Bland–Altman Agreement Plot
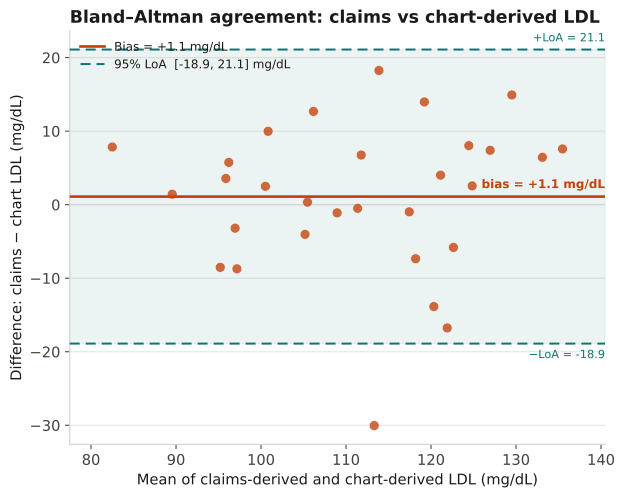
Plots the difference (claims − chart, i.e. Method B − Method A) against the mean of both methods for each paired measurement to assess agreement between two continuous measurement approaches.
When comparing a new or surrogate measurement method (e.g., claims-derived lab value) against a reference standard (e.g., chart-abstracted value) on paired samples from the same subjects. Correlation alone is insufficient — two methods can correlate perfectly yet differ systematically. Bland–Altman exposes both systematic bias and random disagreement independently. Use ICC for overall reliability; use Bland–Altman to understand the clinical magnitude of differences.
Bias line (solid): mean difference between the two methods — a non-zero bias indicates systematic over- or under-estimation by one method. Limits of agreement (dashed): bias ± 1.96 × SD(differences) — 95% of future differences are expected to fall inside these limits if the sample is representative. Points scattered randomly around zero with no fan-shaped pattern indicate constant variance (homoscedastic differences); a funnel shape suggests proportional bias and may require log-transformation before analysis.
30 patients have LDL cholesterol measured by two methods: chart abstraction (reference) and claims-derived coding (surrogate). True LDL ~ Normal(110, 18) mg/dL; chart adds N(0, 6) measurement noise; claims adds N(3, 12) noise (systematic +3 mg/dL upward shift plus greater spread from billing-code rounding). Seed: np.random.default_rng(42).
Result: Bias = +1.1 mg/dL (claims reads marginally higher on average — not clinically meaningful). SD of differences = 10.2 mg/dL. 95% LoA = [−18.9, +21.1] mg/dL. No obvious funnel shape → constant variance assumption holds. Despite small mean bias, individual differences can be up to ~21 mg/dL in either direction, suggesting caution when substituting claims-derived LDL for chart values in analyses that depend on exact cut-points (e.g., < 70 mg/dL for statin-adherence endpoints).
Reference: Gatto NM, Wang SV, Murk W, et al. Visualizations throughout pharmacoepidemiology study planning, implementation, and reporting. Pharmacoepidemiol Drug Saf. 2022;31(11):1140-1152.