Cost-Effectiveness Efficiency Frontier
Plots competing strategies in cost–effect space and connects the non-dominated options into the efficiency frontier, exposing dominated and extended-dominated comparators.
When comparing three or more mutually exclusive strategies — the frontier identifies which options are even worth considering before computing sequential ICERs. The acceptability-frontier (CEAF) variant carries this into probabilistic analysis.
On-frontier strategies are non-dominated; points above/left of the frontier are (simply or extended) dominated and should be dropped. The ICER of each frontier segment is its slope (ΔCost/ΔEffect); only adjacent frontier comparisons are valid.
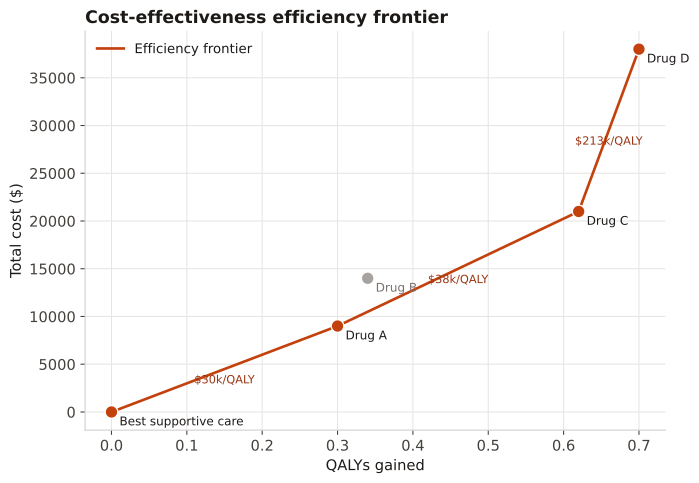
Five strategies (best supportive care + four drugs) are plotted by total cost and QALYs. Strategies are ordered by effect and a strategy is kept on the frontier only if its incremental ICER versus the previous frontier point exceeds the prior segment's ICER.
Result: Drug B is extended-dominated and drops off; the frontier runs BSC → Drug A → Drug C → Drug D with sequential ICERs of $30k, $30.7k, and $213k per QALY — so Drug D is only cost-effective at a very high willingness-to-pay, and Drug B is never optimal.
Reference: Gatto NM, Wang SV, Murk W, et al. Visualizations throughout pharmacoepidemiology study planning, implementation, and reporting. Pharmacoepidemiol Drug Saf. 2022;31(11):1140-1152.