Cost-Effectiveness Plane & Acceptability Curve
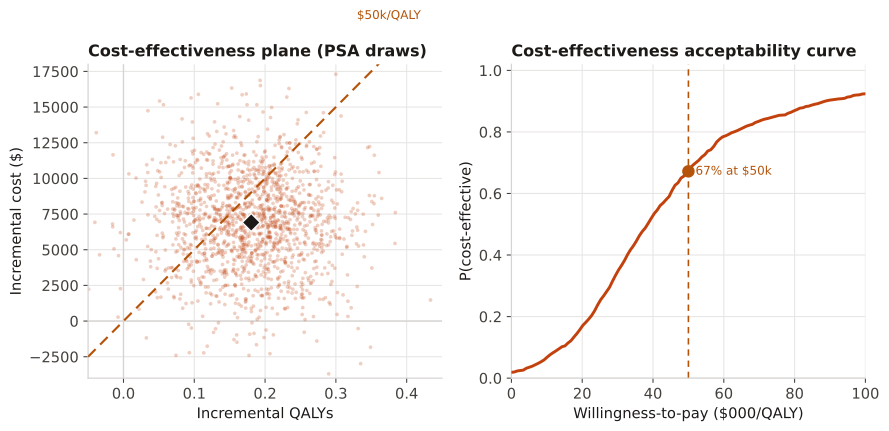
Paired output of a probabilistic sensitivity analysis: a scatter of incremental cost vs QALY draws on the CE plane, and the CEAC giving the probability of cost-effectiveness by WTP.
To express decision (joint parameter) uncertainty in an economic evaluation. The CE plane shows where the Monte Carlo draws land relative to a WTP line; the CEAC summarizes the probability of cost-effectiveness across all WTP thresholds.
On the plane, draws below/right of the WTP line are cost-effective; a cloud straddling the line signals genuine uncertainty. On the CEAC, read the probability of being cost-effective at the relevant threshold (e.g., $50k/QALY).
1500 PSA iterations yield incremental QALYs (mean 0.18) and incremental costs (mean $6,800). The plane plots all draws against a $50k/QALY line; the CEAC counts the share of draws with cost below WTP×QALY across WTP from $0–$100k.
Result: The mean ICER is 6,800/0.18 ≈ $37,800/QALY; most draws fall below the $50k line and the CEAC reads ≈70% probability cost-effective at $50k/QALY, rising toward 1.0 as WTP increases.
Reference: Gatto NM, Wang SV, Murk W, et al. Visualizations throughout pharmacoepidemiology study planning, implementation, and reporting. Pharmacoepidemiol Drug Saf. 2022;31(11):1140-1152.