Decision Curve Analysis (Net Benefit)
Evaluates the clinical usefulness of a prediction model by its net benefit across decision thresholds, against the default strategies of treating everyone or no one.
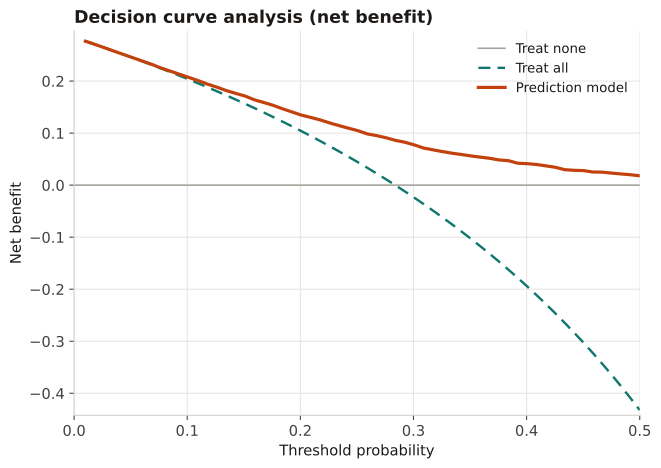
After calibration and discrimination, to answer the decision-relevant question: does acting on this model do more good than harm versus treat-all / treat-none, across the range of thresholds clinicians actually use? Discrimination and calibration alone do not establish clinical utility.
The model is useful over the threshold range where its net-benefit curve sits above both treat-all and treat-none. Net benefit weights false positives by the odds at the threshold, so it expresses true vs false positives on a common, decision-anchored scale.
For 6,000 patients with predicted risks and observed outcomes, net benefit is computed across threshold probabilities p_t: NB = TP/n − FP/n × [p_t/(1−p_t)], and compared to treat-all and treat-none (NB = 0).
Result: At a 10% threshold the model's net benefit exceeds both defaults — e.g., NB ≈ TP/n − FP/n × (0.10/0.90) — so using the model to decide treatment yields more net true positives than treating everyone, across the clinically plausible 5–25% range.
Reference: Vickers AJ, van Calster B, Steyerberg EW. Net benefit approaches to the evaluation of prediction models, molecular markers, and diagnostic tests. BMJ. 2016;352:i6.