E-Value Contour (Unmeasured Confounding)
Quantifies how strong an unmeasured confounder would have to be — on both the exposure and outcome — to fully explain away an observed association, summarized by the E-value.
To express residual-confounding robustness for any ratio estimate from observational data. The E-value needs no assumptions about the confounder's prevalence or direction, which makes it a low-effort, reviewer-friendly sensitivity analysis.
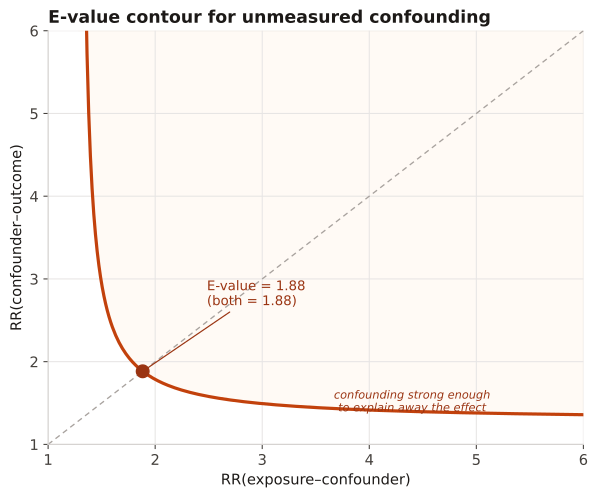
The curve is the set of joint confounder–exposure and confounder–outcome associations (both as risk ratios) that would reduce the estimate to the null; the E-value is the point where both equal. A larger E-value means stronger unmeasured confounding is needed — i.e., a more robust finding.
An adjusted risk ratio of 0.78 (95% CI 0.66–0.92) is converted to its E-value. For a protective estimate the formula uses RR′ = 1/RR; E = RR′ + sqrt(RR′ × (RR′ − 1)).
Result: E-value (point) = 1.282 + sqrt(1.282 × 0.282) = 1.88; E-value (CI bound) = 1.087 + sqrt(1.087 × 0.087) = 1.39. An unmeasured confounder would need RR ≥ 1.88 with BOTH treatment and outcome to explain away the estimate — and ≥ 1.39 to shift the CI to include 1.
Reference: VanderWeele TJ, Ding P. Sensitivity analysis in observational research: introducing the E-value. Ann Intern Med. 2017;167(4):268-274.