Funnel Plot (Small-Study Effects)
Plots each study's effect against its precision to screen a meta-analysis for small-study effects and possible publication bias via funnel asymmetry.
In a meta-analysis with enough studies (≥10 is the usual rule) to assess whether small, imprecise studies report systematically different effects than large ones — a signature of publication or small-study bias. Pair with a formal test (Egger's).
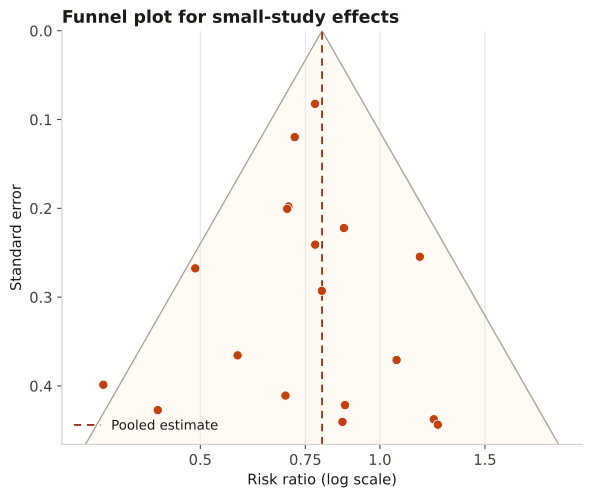
Precise studies cluster near the top around the pooled estimate; less precise studies scatter wider at the bottom, ideally symmetrically inside the funnel. Asymmetry (a missing corner) suggests small negative/null studies are absent from the literature.
Eighteen studies of a risk ratio are plotted as log(RR) on the x-axis against their standard error on an inverted y-axis; pseudo 95% confidence limits are drawn as a funnel around the pooled estimate (log RR = log 0.80).
Result: The studies fall roughly symmetrically inside the funnel and straddle the pooled line, so there is little visual evidence of small-study effects; a formal Egger's test would confirm (p > 0.10) before concluding publication bias is unlikely.
Reference: Gatto NM, Wang SV, Murk W, et al. Visualizations throughout pharmacoepidemiology study planning, implementation, and reporting. Pharmacoepidemiol Drug Saf. 2022;31(11):1140-1152.