Negative-Control Empirical Calibration
Plots effect estimates for negative-control exposures/outcomes (true effect = null) to expose residual systematic error and to calibrate confidence intervals for the real analysis.
In large-scale or high-stakes RWE (e.g., OHDSI-style analyses) to measure the residual bias a design leaves behind. Negative controls have no true effect, so any systematic departure from the null estimates the analysis's residual systematic error.
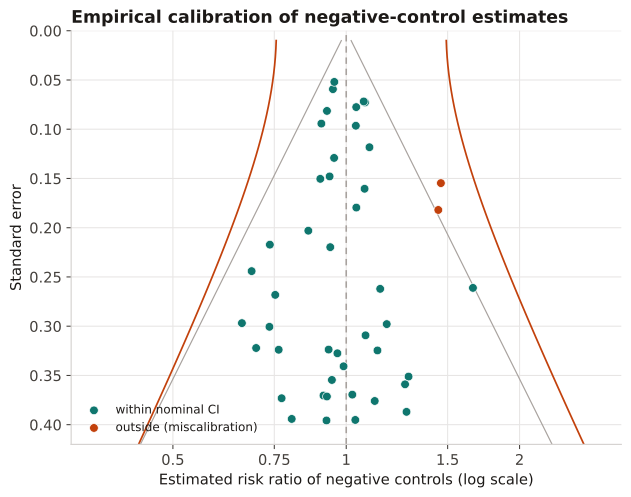
Each point is a negative control; under an unbiased, well-calibrated analysis ~95% fall inside the nominal 95% CI funnel and they center on RR=1. A shifted cloud or many points outside the funnel reveals systematic error; the calibrated null widens CIs for the real estimate accordingly.
Forty-five negative-control exposure–outcome pairs are estimated under the study design; each log risk ratio is plotted against its standard error, with the nominal 95% funnel and the fitted calibrated-null bounds overlaid.
Result: The controls center just right of RR=1 (mean log RR ≈ 0.06) and ~93% fall inside the nominal CI — close to the expected 95% but slightly miscalibrated. The fitted null is used to widen the real estimate's CI, guarding against over-precise inference.
Reference: Schuemie MJ, Hripcsak G, Ryan PB, Madigan D, Suchard MA. Empirical confidence interval calibration for population-level effect estimates. Proc Natl Acad Sci. 2018;115(11):2571-2577.