Network Meta-Analysis Evidence Graph
Displays the geometry of a treatment network — which interventions have been compared directly, and with how much evidence — before pooling direct and indirect comparisons.
At the start of any network meta-analysis, to inspect connectivity and evidence structure. Disconnected nodes cannot be compared; star-shaped networks lean entirely on indirect evidence through a common comparator; thin edges flag fragile links.
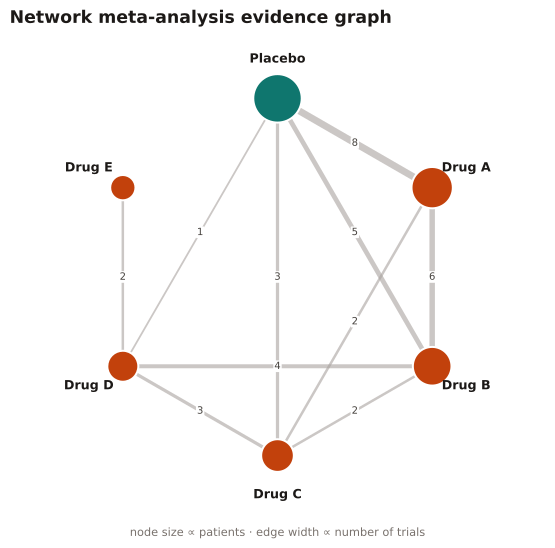
Nodes are treatments (size ∝ patients or trials); edges are direct head-to-head comparisons (width ∝ number of trials). A well-connected network with multiple closed loops supports consistency checks between direct and indirect evidence.
Six treatments (placebo + five drugs) are arranged on a circle; each edge is a head-to-head comparison labeled by its number of trials, with node size scaled to the number of patients on each treatment.
Result: Placebo is the hub (largest node, most connections) and several closed loops (Placebo–A–B) exist, so the network is well connected and supports consistency checks; Drug E sits on a single thin edge, so estimates involving it rest on sparse evidence.
Reference: Gatto NM, Wang SV, Murk W, et al. Visualizations throughout pharmacoepidemiology study planning, implementation, and reporting. Pharmacoepidemiol Drug Saf. 2022;31(11):1140-1152.