Clinical Prediction Nomogram
A graphical tool that lets clinicians estimate the predicted probability from a logistic (or Cox) regression model by reading off point scores for each predictor on separate axes, summing to a total-points axis, and reading the predicted probability directly — no calculation required at the point...
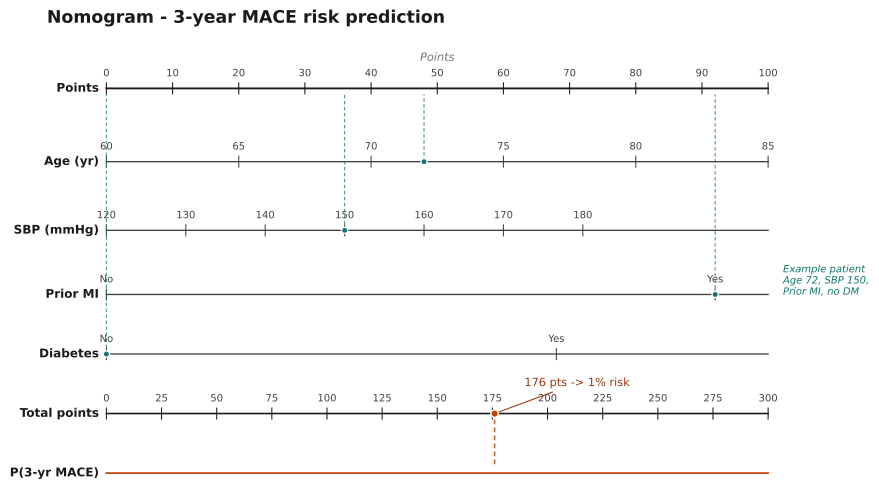
To communicate a multivariable risk prediction model in clinical practice or health technology assessment. Requires a validated logistic or Cox regression model with published coefficients; always validate the model (calibration + discrimination) before deploying a nomogram.
For each predictor, draw a vertical line from the value on its predictor axis to the 'Points' scale (top ruler). Sum the points across all predictors and find the total on the 'Total points' axis; a vertical line from there down to 'Predicted probability' gives the estimated 3-year MACE risk. A patient aged 72, SBP 150 mmHg, with prior MI but no diabetes scores 176 total points → 38% 3-year risk.
Logistic regression predicting 3-year MACE in a cardiovascular outcomes registry. Four predictors: Age (β=0.040/yr, range 60–85), systolic BP (β=0.012/mmHg, range 120–180), prior MI (β=0.920, binary), diabetes (β=0.680, binary). Intercept = −6.100. A single points-per-logit-unit scale of 100 pts/log-odds is applied consistently to all predictors. Patient: Age 72, SBP 150, prior MI yes, diabetes no.
Result: Total 176 pts maps to predicted probability = 1/(1+exp(0.50)) ≈ 38% 3-year MACE risk. logit = −6.10 + 0.040×72 + 0.012×150 + 0.920 + 0 = −0.50. The point-scale arithmetic is exact: pts_per_unit = 100 pts/log-odds. Age (72−60)×0.040×100 = 48 pts; SBP (150−120)×0.012×100 = 36 pts; MI 0.920×100 = 92 pts; Diabetes 0.680×100 = 68 pts (0 for this patient). Total 176 pts → logit −0.50 → P = 37.8%.
Reference: Gatto NM, Wang SV, Murk W, et al. Visualizations throughout pharmacoepidemiology study planning, implementation, and reporting. Pharmacoepidemiol Drug Saf. 2022;31(11):1140-1152.