Regression Diagnostics Panel (Residuals 2×2)
The canonical four-panel regression-diagnostics plot: (1) residuals vs fitted values (checks linearity and homoscedasticity), (2) normal Q-Q plot of standardised residuals (checks normality), (3) scale-location plot (checks constant variance), and (4) residuals vs leverage with Cook's distance...
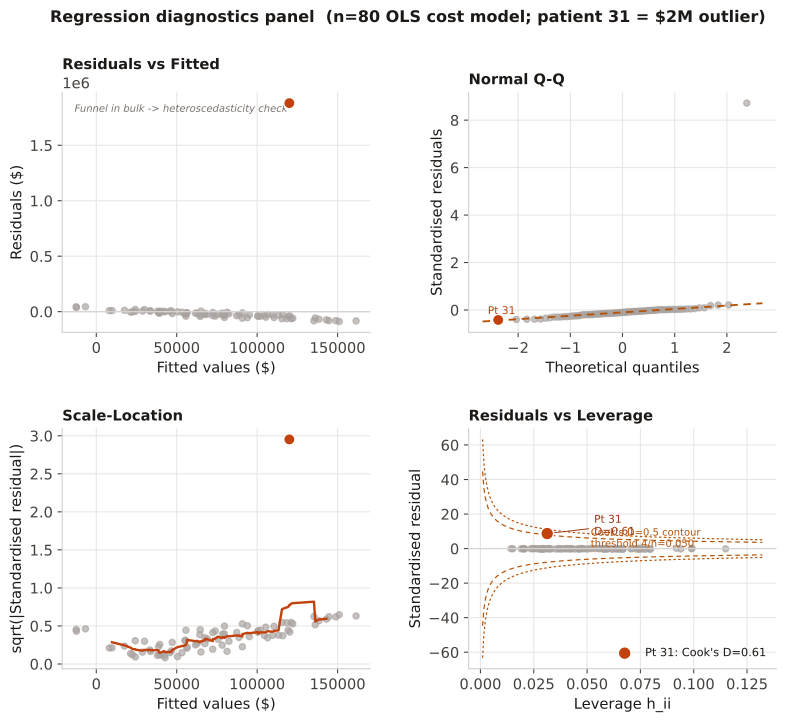
After fitting any OLS or GLM. Run before interpreting coefficients. Residuals-vs-fitted and scale-location catch heteroscedasticity; QQ detects heavy tails or skew that invalidate normal-theory CIs; the leverage/Cook's-D plot flags observations that dominate the fit and may require investigation (data error, biological outlier, coding anomaly).
Residuals-vs-fitted: random scatter around zero → OK; funnel shape → heteroscedasticity. QQ: points on the diagonal → residuals are normal; deviation in tails → skew or heavy tails. Scale-location: flat red line → constant variance. Leverage/Cook's D: points outside Cook's D = 0.5 contour warrant investigation; the flagged $2 M cost outlier (patient 31 in the worked example) has Cook's D = 0.61, well above the conventional 4/n threshold.
An OLS cost model regresses 30-day total cost (USD) on age, comorbidity count, and ICU days for n=80 hospitalised patients. Patient 31 incurred $2 000 000 in costs (a catastrophic outlier) and has fitted value $120 002, giving a raw residual of $1 879 998 and a standardised residual of +8.72. Leverage h_31 = 0.031. Cook's D = (8.72² × 0.031) / (4 × (1 − 0.031)) = 2.36 / 3.88 = 0.61. The conventional threshold is 4/n = 4/80 = 0.05; D_31 = 0.61 vastly exceeds it.
Result: Panels 1–3 are approximately satisfactory for the 79 non-outlier patients (residuals roughly symmetric, QQ linear, scale-location flat). Panel 4 confirms patient 31 as a high-influence point: Cook's D 0.61 >> 4/n=0.05, pulling the regression line toward high cost predictions. Analysts should investigate the record, confirm data accuracy, and report sensitivity analyses with and without the outlier.
Reference: Gatto NM, Wang SV, Murk W, et al. Visualizations throughout pharmacoepidemiology study planning, implementation, and reporting. Pharmacoepidemiol Drug Saf. 2022;31(11):1140-1152.