ROC Curve
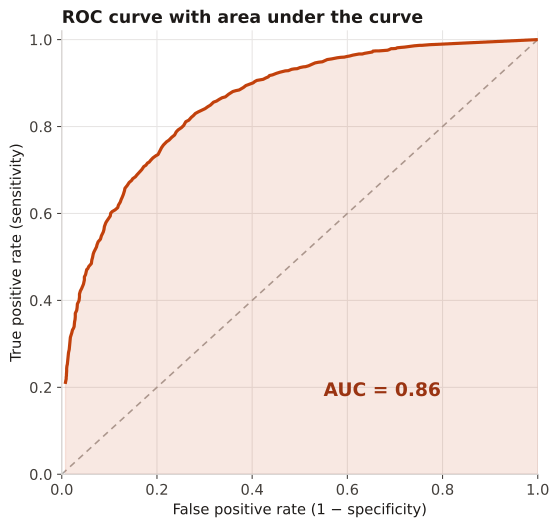
Discrimination diagnostic: sensitivity against 1−specificity over all classification thresholds, with the area under the curve (AUC / c-statistic) as a summary.
To summarize how well a model or score separates events from non-events independent of any single threshold. Pair with a calibration plot — AUC says nothing about whether predicted risks are numerically correct.
The curve bows toward the top-left as discrimination improves; the diagonal is chance (AUC 0.5). AUC is the probability a random event outranks a random non-event. For imbalanced outcomes, also inspect the precision-recall curve.
A model score for 4,000 patients (≈50% events) is thresholded across its range; at each threshold the true-positive rate and false-positive rate are computed and plotted, and the area under the resulting curve is integrated.
Result: The curve bows above the chance diagonal with AUC ≈ 0.79 — meaning a random patient with the event has a higher score than a random patient without it about 79% of the time — indicating good but not excellent discrimination.
Reference: Gatto NM, Wang SV, Murk W, et al. Visualizations throughout pharmacoepidemiology study planning, implementation, and reporting. Pharmacoepidemiol Drug Saf. 2022;31(11):1140-1152.