UpSet Plot of Comorbidity Combinations
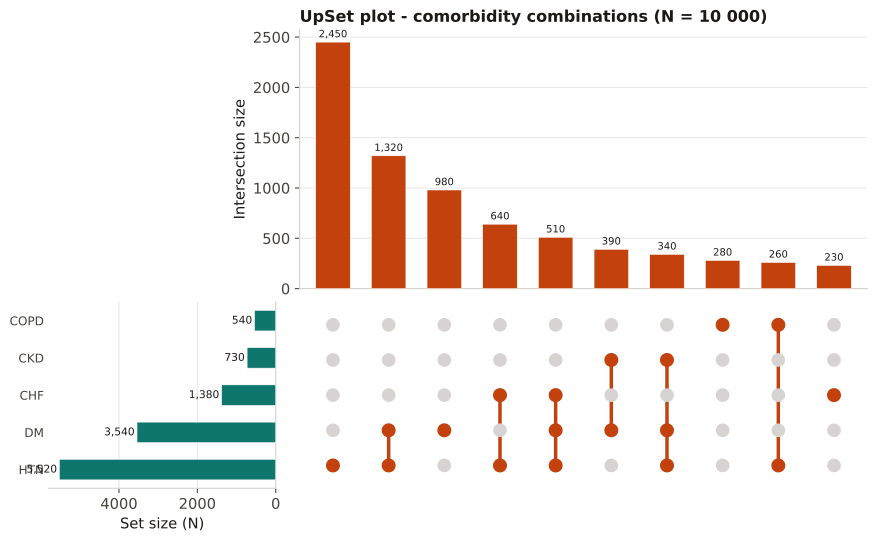
An UpSet plot displays the prevalence of every comorbidity combination in a cohort, overcoming the combinatorial explosion that makes Venn diagrams unreadable beyond three sets. Horizontal set-size bars (left) show marginal condition prevalence;
To characterize a claims or EHR cohort's comorbidity landscape, identify dominant co-occurring condition clusters, and expose which combinations are most common — informing propensity-score covariate selection and subgroup analyses. Particularly useful when ≥4 comorbidities are of interest.
Read the tallest bars first — they are the most prevalent combinations. Single-condition bars indicate patients with only that condition; multi-dot columns show co-occurrence clusters. The set-size bar chart on the left gives the marginal (any occurrence) prevalence of each condition. Combinations absent from the top-N bars can still be inferred: total minus displayed intersections = remaining combinations.
10 000 adults with at least one cardiovascular or metabolic ICD-10-CM code in the 12 months before index date. Five conditions: hypertension (HTN), diabetes (DM), congestive heart failure (CHF), COPD, chronic kidney disease (CKD). Top 10 intersections are displayed.
Result: HTN is the dominant single condition (2 450 isolated; 5 520 total). HTN+DM co-occurrence (1 320 = 13.2% of cohort) is the most prevalent two-way combination. Triple comorbidity HTN+DM+CHF (510, 5.1%) is the most common three-way cluster. Top-10 intersections capture 7 400/10 000 = 74.0% of the cohort — the remaining 2 600 patients have other or no condition combinations.
Reference: Gatto NM, Wang SV, Murk W, et al. Visualizations throughout pharmacoepidemiology study planning, implementation, and reporting. Pharmacoepidemiol Drug Saf. 2022;31(11):1140-1152.