Case-Time-Control Design Diagram
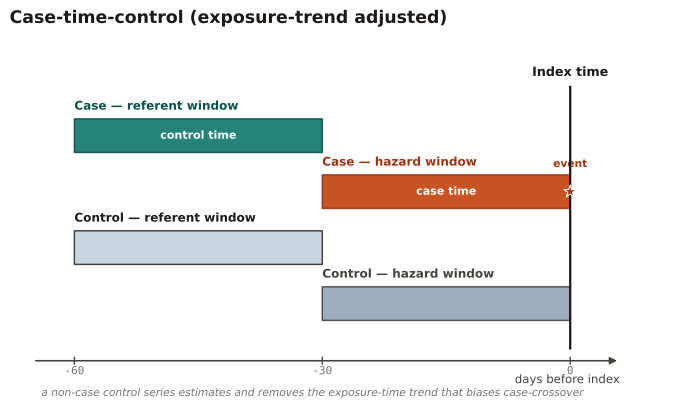
The case-time-control design drawn in the Schneeweiss/Gatto convention — assessment, exposure, and follow-up windows anchored on a timeline so the design's temporal logic is explicit.
When a case-crossover analysis is threatened by an exposure-prevalence time trend (uptake rising over calendar time): add a non-case control series whose own crossover odds estimate and remove that trend.
Cases contribute a hazard vs referent window (as in case-crossover); a matched control series contributes the same windows. The control group's crossover odds ratio captures the exposure-time trend, which divides out of the case estimate.
A case provides hazard and referent windows around its event; a control subject provides the same two windows at the same index time, supplying a trend estimate.
Result: The control series' crossover odds ratio estimates the exposure-time trend that biases a plain case-crossover; dividing it out yields the trend-adjusted effect — the diagram shows exactly which windows supply that correction.
Reference: Schneeweiss S, Rassen JA, Brown JS, et al. Graphical Depiction of Longitudinal Study Designs in Health Care Databases. Ann Intern Med. 2019;170(6):398-406.