Longitudinal Study-Design Diagram
The recommended graphical specification of a database study: covariate, washout, exposure, induction, and follow-up windows drawn on a timeline anchored at time zero.
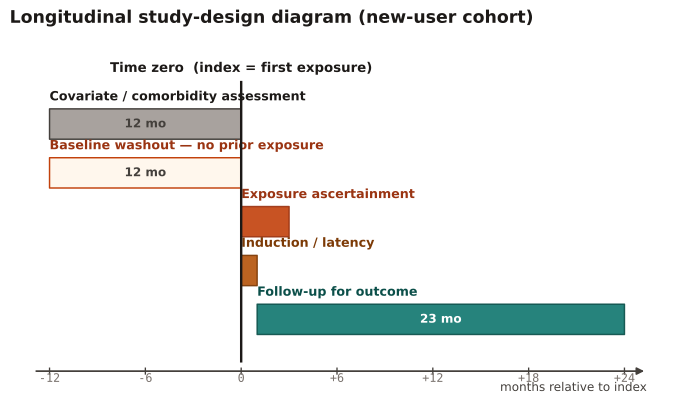
At the design stage of every longitudinal database study, and in the protocol/manuscript. This is the Schneeweiss et al. (2019) design-diagram convention adopted by STaRT-RWE; it exposes immortal-time and look-ahead errors that prose hides.
Read left to right relative to time zero (the index/exposure start). Covariates must be assessed strictly before time zero; follow-up must start at or after time zero. Any window that crosses time zero in the wrong direction is a design red flag.
A new-user cohort with a 12-month pre-index covariate assessment and washout, exposure ascertained from index over 3 months, a 1-month induction, and outcome follow-up to 24 months. Each window is a bar on a month axis centered on time zero.
Result: Because the covariate window sits entirely left of time zero and follow-up begins at +1 month (after induction, not before exposure), the diagram demonstrates no immortal time and no covariate look-ahead — the design is specified correctly.
Reference: Schneeweiss S, Rassen JA, Brown JS, et al. Graphical Depiction of Longitudinal Study Designs in Health Care Databases. Ann Intern Med. 2019;170(6):398-406.