Self-Controlled Risk Interval (SCRI) Design Diagram
The self-controlled risk interval design drawn in the Schneeweiss/Gatto convention — assessment, exposure, and follow-up windows anchored on a timeline so the design's temporal logic is explicit.
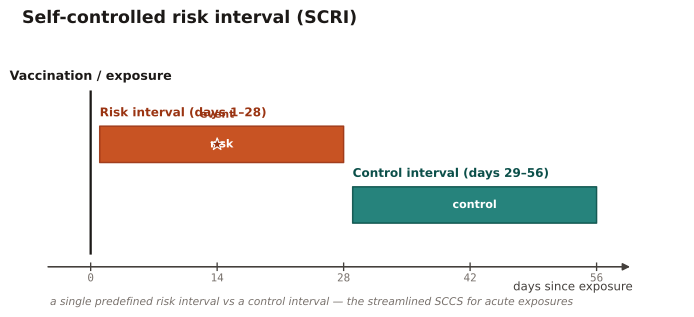
The streamlined SCCS for a point exposure with a short, biologically defined risk period (vaccine safety in particular): compare a predefined risk interval to a nearby control interval in the same person.
A single risk interval after exposure and a single control interval are predefined; the event rate is compared between them within each person. Shorter windows reduce exposure to time-varying confounding than full-observation SCCS.
After vaccination at day 0, a days-1–28 risk interval is compared with a days-29–56 control interval in the same person; an event falls in the risk interval.
Result: Predefining a single risk vs control interval keeps the comparison tightly within-person and over a short span, minimizing time-varying confounding — the diagram shows why SCRI is the workhorse for acute vaccine-safety signals.
Reference: Schneeweiss S, Rassen JA, Brown JS, et al. Graphical Depiction of Longitudinal Study Designs in Health Care Databases. Ann Intern Med. 2019;170(6):398-406.