Self-Controlled Risk Interval (SCRI) Design
A within-person design that compares the rate of an acute event in a pre-defined risk interval shortly after a transient exposure with the rate in a pre-defined control interval in the same person, so that all time-fixed individual characteristics cancel; the focused special case of the self-controlled case series used heavily in vaccine safety.
On this page
The Self-Controlled Risk Interval (SCRI) design asks whether a one-time event like a vaccine raises the short-term chance of a side effect by comparing what happens to the same person in a narrow window right after the exposure versus a later window in the same person. Because both windows belong to the same individual, everything fixed about that person — their genes, their underlying health, how often they see a doctor — is automatically held constant and cannot distort the answer. The design counts only people who actually had the side effect, and it delivers a single number: how many times more often the event occurred in the post-vaccination risk window than in the later comparison window.
Core idea
The self-controlled risk interval (SCRI) design studies whether a transient exposure (most often a vaccine dose) raises the short-term rate of an acute event by comparing, within each affected individual, the event count in a pre-specified risk interval following exposure against the count in a pre-specified control interval in the same person.
Because every comparison is made within a single individual, all characteristics that do not change over the observation period — genetics, sex, baseline frailty, chronic comorbidity, socioeconomic status, healthcare- seeking propensity — are exactly conditioned out: they are constant and cannot confound a within-person contrast. Only cases (people who experienced the event) contribute information; unexposed-or-no-event time and between-person comparisons are discarded.
The effect measure is a relative incidence (incidence rate ratio) comparing the event rate per unit time in the risk interval to that in the control interval, estimated by conditional Poisson regression (equivalently, fixed-effects/conditional likelihood that strata on the individual) with an offset for the length of each interval. SCRI is the deliberately focused cousin of the full self-controlled case series (SCCS): rather than modelling the entire observation period, it pre-specifies a narrow risk window and a narrow comparison window, trading some statistical efficiency for transparency and robustness to long-range time trends.
Relationship to the SCCS
SCRI is a variant of the self-controlled case series (`self-controlled-case-series`): the SCCS uses the full observation time as the comparison and models age/seasonal time with explicit terms; SCRI restricts the comparison to a short, pre-defined control interval near the exposure.
The narrow control interval makes SCRI far less sensitive to long-term secular and age trends (a major SCCS assumption) at the cost of using less of the data, so SCRI is preferred when the event rate has strong age/season structure that is hard to model but is roughly flat over the short risk-plus-control span. Both share the same estimator (conditional Poisson) and the same three core assumptions below.
The three assumptions that make SCRI valid
(1) The event must not affect the probability of subsequent exposure. If having the event changes whether or when a person is (re)vaccinated, the within-person comparison is biased; this is why SCRI/SCCS are appropriate for transient exposures like vaccination that are scheduled independently of the acute event, and inappropriate when the event contraindicates further exposure.
(2) The event must not (substantially) censor or curtail observation, i.e., it should be non-fatal or rare enough that survivor bias from event-related death is negligible; when the event can be fatal, modified SCCS estimators that account for event-dependent observation are required.
(3) No time-varying confounding across the risk and control intervals other than the exposure — the underlying event rate must be constant (or modelled) across the short window, so a sharp peri-event spike unrelated to the exposure (e.g., a concurrent seasonal epidemic) would violate the design unless the control interval is chosen to share that background.
Pros, cons, and trade-offs
- vs cohort / between-person designs: SCRI eliminates all time-fixed confounding by construction, needs no unexposed comparator, and is immune to the confounding-by-indication that plagues between-person vaccine-safety studies.
Cost: it estimates only the relative short-term effect (not an absolute risk or a long-term effect), uses cases only, and is exposed to bias from time-varying confounders within the window. Prefer SCRI for acute events after transient exposures where time-fixed confounding is the dominant threat; prefer a cohort design when an absolute risk, a long-term effect, or an unexposed comparison is the question. - vs the full SCCS (`self-controlled-case-series`): SCCS is more efficient (uses all observation time) but requires correctly modelling age/season trends across the whole period and the no-event-dependent-observation assumption over a longer span.
SCRI's short control interval buys robustness to long-range trends and simpler pre-specification. Prefer SCRI when long-term time trends are strong and hard to model and the risk window is short; prefer SCCS when efficiency matters and the time structure can be modelled. - vs the case-crossover design (`case-crossover`): Both are within-person, but case-crossover compares exposure status in case vs control windows referenced to the event (case-defined sampling), whereas SCRI compares event counts in risk vs control windows referenced to the exposure (exposure-defined sampling).
Case-crossover suits transient exposures and abrupt outcomes (the classic trigger study); SCRI suits a fixed-time exposure (a vaccine dose) with a clear post-exposure risk window. They can be biased by exposure-time trends in opposite ways.
When NOT to use — and when it is actively misleading or dangerous
- The event changes subsequent exposure. If experiencing the outcome makes further vaccination more or less likely (e.g., a reaction that contraindicates the next dose), the core assumption fails and the relative incidence is biased; using SCRI here is a structural error no amount of window tuning fixes.
- The event is commonly fatal. Event-dependent censoring (death) breaks the standard estimator; a naive SCRI on a high-fatality outcome overstates or understates the effect. Use event-dependent SCCS extensions or a different design.
- Time-varying confounding within the window. A seasonal epidemic, a co-administered intervention, or an age effect that differs sharply between the risk and control intervals contaminates the contrast; SCRI cannot adjust for what it does not model, and a poorly placed control interval bakes the bias in.
- Reading a relative incidence as an absolute or long-term risk. SCRI delivers a short-window rate ratio only; narrating it as the probability a vaccinee will be harmed, or as a chronic effect, misrepresents the estimand.
- A pre-exposure risk period contaminated by the indication. If people are exposed because of early symptoms of the event (e.g., vaccinated during a prodrome), event counts cluster just before exposure; ignoring a pre-exposure window biases the risk-interval estimate. Model or exclude the pre-exposure period.
Data-source operational depth
- Claims: Exposure (vaccine administration) is captured by CPT/CVX/NDC codes with a service date that anchors the risk and control intervals; the acute outcome is an inpatient or ED claim with a specific diagnosis and admission date.
Require continuous enrollment spanning the entire observation window so neither interval is truncated by disenrollment, and restrict to fee-for-service-observable time so Medicare Advantage gaps do not silently shorten an interval. Same-day duplicate/reversed claims and claims lag near the data cut must be cleaned before counting events.
- EHR: Vaccine administration may be recorded in an immunization table or as an order; outcomes are encounter-driven, so an event treated elsewhere is missed and can differentially shorten an interval. Require demonstrable in-system activity across the observation window and confirm the immunization record is complete (often supplemented by a state immunization information system in linked data).
- Registry / linked (e.g., Vaccine Safety Datalink, Sentinel): The strongest substrate: an immunization registry supplies exact dose dates and a linked claims/EHR feed supplies adjudicated, well-dated acute events. Linkage selects the linkable subset and dose-date vs claim-date discrepancies must be reconciled before assigning intervals; these distributed networks are where SCRI is most heavily deployed for near-real-time signal monitoring.
Decision diagram
flowchart LR
  Dose([Vaccine dose<br/>time zero]) --> Pre[Pre-exposure window<br/>exclude or model]
  Dose --> Risk[Risk interval<br/>e.g., days 0-7]
  Dose --> Control[Control interval<br/>e.g., days 14-42]
  Risk --> Count1[Event count in risk interval]
  Control --> Count2[Event count in control interval]
  Count1 --> RI[Conditional Poisson<br/>relative incidence = rate_risk / rate_control]
  Count2 --> RI
  RI --> Within[Within-person: all time-fixed<br/>confounders cancel]
flowchart TD
  Q{Transient exposure + acute outcome?} -->|No| Other[Use a cohort or other design]
  Q -->|Yes| A1{Does the event change<br/>subsequent exposure?}
  A1 -->|Yes| Stop1[SCRI invalid<br/>assumption violated]
  A1 -->|No| A2{Is the event commonly fatal?}
  A2 -->|Yes| Stop2[Event-dependent censoring<br/>use modified SCCS]
  A2 -->|No| A3{Background rate flat across<br/>risk + control span?}
  A3 -->|No, strong trend| SCCS[Prefer full SCCS with<br/>time modelling]
A3 -->|Yes| SCRI[SCRI appropriate<br/>conditional Poisson relative incidence]Worked example
Scenario
Researchers want to know whether the influenza vaccine raises the short-term risk of febrile seizures in young children. They pull claims data for 8 children who each had at least one febrile seizure during the study period. For each child, they define two windows anchored on the date the vaccine was given: a risk interval of 8 days (days 1 through 8 after the dose) and a control interval of 29 days (days 15 through 43 after the dose). They count how many seizures each child had in each window, then compare the rates.
Dataset
One row per child per interval. Each child appears twice: once for the risk interval and once for the control interval. events = seizures counted in that window; ptime = how many days that window lasts.
| person_id | interval | events | ptime_days |
|---|---|---|---|
| C001 | risk | 1 | 8 |
| C001 | control | 0 | 29 |
| C002 | risk | 1 | 8 |
| C002 | control | 0 | 29 |
| C003 | risk | 0 | 8 |
| C003 | control | 1 | 29 |
| C004 | risk | 1 | 8 |
| C004 | control | 0 | 29 |
| C005 | risk | 1 | 8 |
| C005 | control | 0 | 29 |
| C006 | risk | 1 | 8 |
| C006 | control | 1 | 29 |
| C007 | risk | 1 | 8 |
| C007 | control | 0 | 29 |
| C008 | risk | 0 | 8 |
| C008 | control | 1 | 29 |
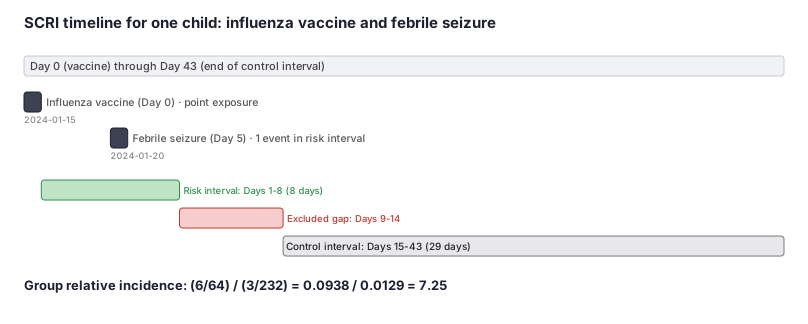
Steps
Result
Relative incidence = 7.25, meaning febrile seizures occurred about 7 times more often in the 8 days right after the vaccine dose than in the later 29-day control window, in the same children. (Risk rate: 6 events / 64 child-days = 0.0938 per child-day; Control rate: 3 events / 232 child-days = 0.0129 per child-day; ratio = 7.25.)
Trade-offs
Runnable example
SCRI relative incidence by conditional Poisson regression. Input is one row per (case, interval): person_id, period ('risk' or 'control'), events (count in that interval for that person), and ptime (interval length in days).
import numpy as np
import pandas as pd
import statsmodels.formula.api as smf
import statsmodels.api as sm

# Long format: two rows per case (risk + control). 'events' is the count; 'ptime' is interval length (days).
# Example: risk = days 0-7 (8 days), control = days 14-42 (29 days) after the dose.
df = pd.DataFrame({
    "person_id": np.repeat(np.arange(1, 9), 2),
    "period":    ["risk", "control"] * 8,
    "events":    [1, 0, 1, 0, 0, 1, 1, 0, 1, 0, 1, 1, 1, 0, 0, 1],
    "ptime":     [8, 29] * 8,
})
df["risk"]    = (df["period"] == "risk").astype(int)
df["log_pt"]  = np.log(df["ptime"])

# Conditional Poisson via person fixed effects + length offset. C(person_id) strata the individual,
# so all time-fixed characteristics cancel; exp(beta_risk) is the relative incidence.
fit = smf.glm("events ~ risk + C(person_id)", data=df,
              family=sm.families.Poisson(), offset=df["log_pt"]).fit()
ri  = np.exp(fit.params["risk"])
ci  = np.exp(fit.conf_int().loc["risk"])
print(f"Relative incidence (risk vs control) = {ri:.2f} "
      f"(95% CI {ci[0]:.2f}-{ci[1]:.2f})")
SCRI relative incidence with the SCCS package (the standard R implementation of self-controlled case series / risk interval), and the equivalent gnm conditional-Poisson fit. Input mirrors the Python version: per-case risk and control intervals with event counts and interval lengths.
library(gnm)

# Long format: two rows per case (risk + control); events = count, ptime = interval length (days).
dat <- data.frame(
  person_id = factor(rep(1:8, each = 2)),
  period    = rep(c("risk", "control"), 8),
  events    = c(1,0, 1,0, 0,1, 1,0, 1,0, 1,1, 1,0, 0,1),
  ptime     = rep(c(8, 29), 8)
)
dat$risk   <- as.integer(dat$period == "risk")
dat$log_pt <- log(dat$ptime)

# Conditional Poisson: eliminate person-specific intercepts (the within-person conditioning),
# offset by log interval length; exp(coefficient) on risk is the relative incidence.
fit <- gnm(events ~ risk + offset(log_pt), eliminate = person_id,
           family = poisson, data = dat)
ri  <- exp(coef(fit)["risk"])
ci  <- exp(confint.default(fit)["risk", ])
cat(sprintf("Relative incidence (risk vs control) = %.2f (95%% CI %.2f-%.2f)\n",
            ri, ci[1], ci[2]))
SCRI relative incidence in SAS via conditional Poisson, fit as a fixed-effects Poisson stratified on the individual. Input dataset work.scri has one row per (person_id, period) with events and ptime (interval length in days).
/* Build the offset and the risk indicator. */
data scri;
  set work.scri;                 /* person_id, period ('risk'/'control'), events, ptime */
  risk   = (period = 'risk');    /* 1 = risk interval, 0 = control interval */
  log_pt = log(ptime);           /* offset for unequal interval lengths      */
run;

/* Conditional Poisson as person-stratified fixed-effects Poisson.
   CLASS person_id with the person term conditions out all time-fixed characteristics;
   exp(estimate for risk) is the relative incidence (risk vs control). */
proc genmod data=scri;
  class person_id;
  model events = risk person_id / dist=poisson link=log offset=log_pt;
  estimate 'log relative incidence (risk vs control)' risk 1 / exp;
run;
Citations
- [1]Li R, Stewart B, Weintraub E. Evaluating efficiency and statistical power of self-controlled case series and self-controlled risk interval designs in vaccine safety. Journal of Biopharmaceutical Statistics. 2016;26(4):686-693.
- [2]Li R, Kulldorff M, Russek-Cohen E, Kawai AT, Hua W. Quantifying the impact of time-varying baseline risk adjustment in the self-controlled risk interval design. Pharmacoepidemiology and Drug Safety. 2015;24(12):1304-1312.
- [3]Whitaker HJ, Farrington CP, Spiessens B, Musonda P. Tutorial in biostatistics: the self-controlled case series method. Statistics in Medicine. 2006;25(10):1768-1797.