Event-Study Plot (DiD Parallel-Trends Diagnostic)
Displays treatment-effect estimates (β_t) and 95% CIs for each period relative to the omitted pre-treatment reference period (t=−1) in a difference-in-differences or staggered-adoption design.
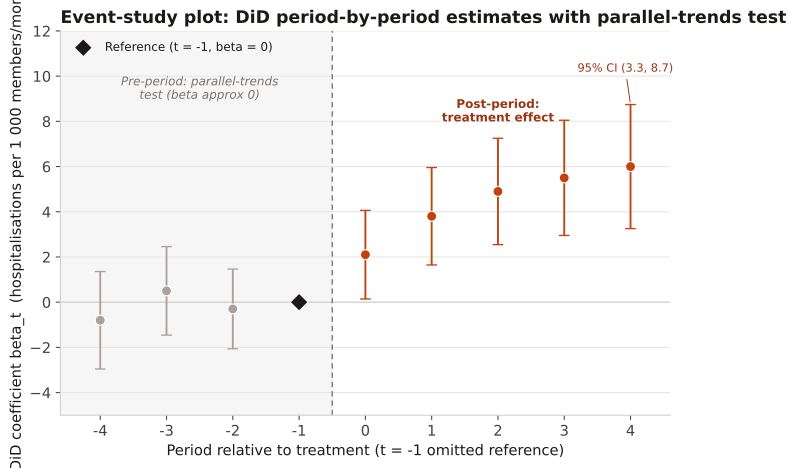
After fitting a two-way fixed-effects (or Sun–Abraham / Callaway–Sant'Anna) model with full leads and lags. Plot all pre-treatment coefficients to test parallel trends — they should be jointly indistinguishable from zero. Post-treatment coefficients reveal whether the effect is immediate, delayed, or fading.
β_{t=−1} is normalized to 0 (reference). Pre-period coefficients wandering from zero signal pre-existing trends that violate parallel trends. Post-period estimates rising above zero indicate a treatment effect. Wide CIs for early pre-periods reflect smaller effective samples and are expected.
A claims-based DiD study evaluates a formulary policy change (treatment) on monthly hospitalisation rate per 1 000 members. The model is fit with 4 pre-periods (t = −4 to t = −2; t = −1 is the omitted reference) and 5 post-periods (t = 0 to t = +4). Coefficients and SEs are extracted from the TWFE regression.
Result: Pre-period coefficients −0.8, +0.5, −0.3 are all within ±2 SE of zero (joint F-test p = 0.71), supporting parallel trends. Post-period estimates rise monotonically from 2.1 at t=0 to 6.0 at t=+4, indicating a growing treatment effect of ≈6 hospitalisations per 1 000 members per month by the fourth post-period. The 95% CI at t+4 is 6.0 ± 1.96 × 1.4 = (3.26, 8.74).
Reference: Gatto NM, Wang SV, Murk W, et al. Visualizations throughout pharmacoepidemiology study planning, implementation, and reporting. Pharmacoepidemiol Drug Saf. 2022;31(11):1140-1152.