Expected Value of Perfect Information (EVPI) Curve
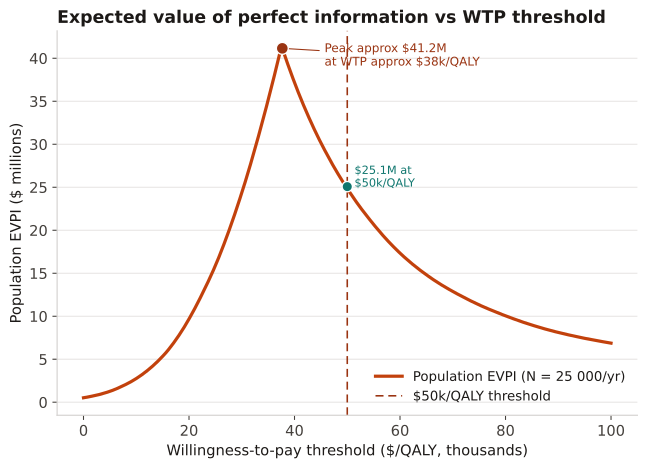
Plots population EVPI against the willingness-to-pay (WTP) threshold, showing how the maximum societal value of resolving all decision uncertainty peaks near the threshold where the probability of making the wrong decision is highest — the same zone of maximum CEAC uncertainty.
After a PSA to determine whether additional research could ever be worth funding. Population EVPI establishes an upper bound on the value of any further study; if it is low, no study design can be cost-effective to conduct.
At low WTP the new treatment is almost never cost-effective, so no decision uncertainty exists and EVPI ≈ 0. At high WTP it is almost always cost-effective, again near-zero uncertainty. EVPI peaks at the WTP where the CEAC crosses 50%, i.e., where the probability of each decision is roughly equal. The peak value is the maximum per-decision regret multiplied by the target population size.
1 500 PSA iterations with ΔQALY ~ N(0.18, 0.07) and ΔCost ~ N($6 800, $3 200). Eligible population N = 25 000 patients per year. EVPI is swept over WTP $0–$100 000/QALY.
Result: The curve peaks at WTP ≈ $37 500/QALY (≈ the mean ICER of $6 800 / 0.18 ≈ $37 800) where per-decision EVPI is highest. Peak population EVPI ≈ $41.3 M, indicating further research could be worth up to that amount. At the $50 000/QALY threshold population EVPI ≈ $24.9 M, still sizable but declining as the new treatment becomes more likely cost-effective.
Reference: Gatto NM, Wang SV, Murk W, et al. Visualizations throughout pharmacoepidemiology study planning, implementation, and reporting. Pharmacoepidemiol Drug Saf. 2022;31(11):1140-1152.