Kaplan–Meier Survival Curve
Non-parametric estimate of the survival function S(t) per group, the default figure for any time-to-event outcome with right-censoring and a single absorbing event.
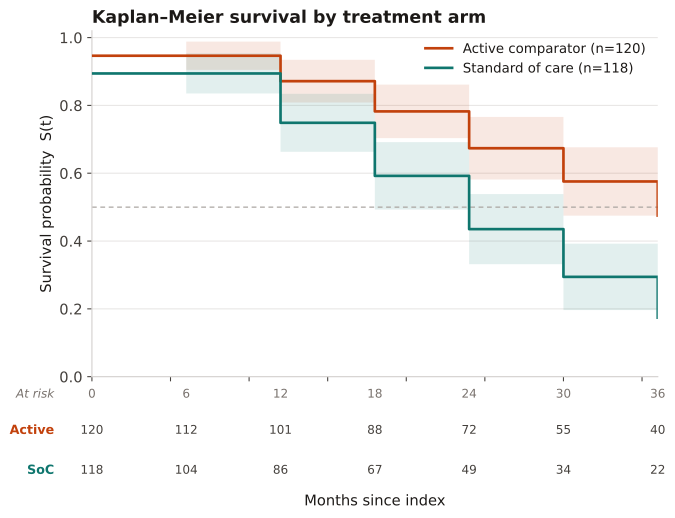
One absorbing event (death, first relapse) with right-censoring and negligible competing risks. With meaningful competing events, use the cumulative incidence function instead — KM treats competing events as censoring and overstates risk.
Each drop is an event; the curve is flat between events and steps only at event times. Read median survival where S(t) crosses 0.50; always pair with a numbers-at-risk table because late-curve estimates rest on few patients.
238 new initiators (120 active comparator, 118 standard of care) followed 36 months. The life table below gives the number at risk and events per 6-month interval for each arm; KM multiplies the interval-specific survival fractions S(t)=∏(1−d_i/n_i).
Result: At 18 months the active-arm survival is 0.94×(1−6/112)×(1−8/101)×(1−9/88) = 0.78; the active curve stays above standard-of-care throughout, with median survival not reached (active) vs ~26 months (SoC).
Reference: Gatto NM, Wang SV, Murk W, et al. Visualizations throughout pharmacoepidemiology study planning, implementation, and reporting. Pharmacoepidemiol Drug Saf. 2022;31(11):1140-1152.