Proportional-Hazards Diagnostic (log–log & Schoenfeld)
The standard check that a Cox model's proportional-hazards assumption holds: parallel log–log survival curves and flat, time-independent scaled Schoenfeld residuals.
After fitting any Cox model and before trusting its hazard ratio. If hazards are non-proportional, a single HR is a time-averaged summary that can mislead; switch to time-varying effects, RMST, or stratification.
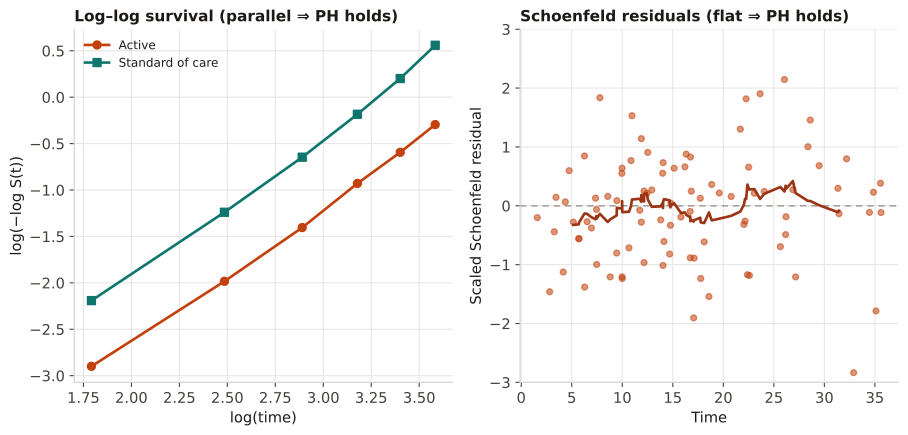
Log–log curves that stay parallel (do not cross) support PH; a sloped or curved Schoenfeld residual trend (or a small global test p-value) indicates a time-varying effect for that covariate.
A two-arm Cox model is checked two ways: log(−log S(t)) is plotted against log(time) for each arm, and the scaled Schoenfeld residuals for the treatment indicator are plotted against time with a smoother.
Result: The two log–log curves are roughly parallel and the residual smoother is flat around zero (global cox.zph p ≈ 0.4), so the proportional-hazards assumption is reasonable and the reported hazard ratio is interpretable as a constant effect.
Reference: Gatto NM, Wang SV, Murk W, et al. Visualizations throughout pharmacoepidemiology study planning, implementation, and reporting. Pharmacoepidemiol Drug Saf. 2022;31(11):1140-1152.