Case Report
A descriptive observational design that documents the detailed clinical course, exposures, interventions, and outcomes of a single patient (or a handful), reported under the CARE checklist to generate hypotheses and surface safety signals that aggregate analyses miss.
On this page
A case report is a detailed written story of what happened to a single patient: their history, the drug or treatment they got, the problem that showed up afterward, and the doctor's reasoning about whether the treatment might have caused it. Its job is to describe and to raise a question ("has anyone ever seen this before?"), not to measure anything. Because there is only one patient and no comparison group, you cannot turn it into a rate or a risk — there is no group of people to divide by, so "3 out of how many?" has no answer. That is the whole point of the design, not a flaw to fix.
A case report is a structured narrative of one patient's clinical course — relevant history, the index exposure (drug, device, procedure, vaccine), co-interventions, the outcome, and the investigator's reasoning about whether the exposure plausibly caused the outcome. In RWE and pharmacoepidemiology its job is signal generation and detailed description, not measurement: it documents an unexpected adverse event, a novel phenotype, or an exceptional treatment response in enough granularity that others can recognize the same pattern. The contemporary reporting standard is the CARE checklist (title, keywords, abstract, introduction, patient information, clinical findings, timeline, diagnostic assessment, therapeutic intervention, follow-up and outcomes, discussion, patient perspective, informed consent); a report that omits the timeline or the consent statement is not publishable to current standards.
Why there is no estimand here
A case report has no denominator and no comparison group, so it cannot estimate a rate, a risk, or an effect — there is nothing to be unbiased about. This is the defining feature, not a limitation to be patched. It means the familiar machinery of comparative RWE (time zero, washout, propensity scores, competing-risk estimands) does not apply to the inference, even though that machinery reappears below as a case-finding tool. The practical decision rule: if your question is "does A cause/prevent Y?" or "how common is Y?", a case report is the wrong design and you need a comparative cohort, case-control, or self-controlled analysis. If your question is "has anyone ever seen Y after A, and what did it look like?", the case report is the right and often only feasible design — it is how thalidomide embryopathy, clozapine agranulocytosis, and rofecoxib thrombosis first entered the literature.
Pros, cons, and trade-offs
- vs case series: A single report is faster, cheaper, and can stand alone for a truly first-in-kind event, but it supports no pattern recognition and invites over-interpretation of a coincidence. Prefer a single report only for the first description of a novel signal or an N-of-1 response; the moment you have 2-5 similar patients, a case series with a denominator-aware discussion is more persuasive.
- vs case-control / cohort: A case report needs no sampling frame, control group, or analysis plan and turns around in weeks, but it cannot quantify association or incidence and its selection ("only the interesting one got written up") and information biases are extreme. Prefer a comparative design the instant the goal shifts from "describe" to "estimate."
- vs spontaneous-report systems (FAERS / EudraVigilance): A spontaneous report is a coded line item optimized for disproportionality screening across millions of records; a case report is a rich, adjudicated narrative optimized for causality assessment of one patient. They are complements: a disproportionality signal motivates pulling and publishing illustrative case reports, and a striking case report motivates querying the spontaneous-report database for corroboration.
- vs systematic review: Individual case reports are the raw material a later review of rare events synthesizes, but each report carries severe publication bias (positive/dramatic cases are written up, null observations are not), so a review of case reports estimates the literature, not the world.
When NOT to use — and when it is actively misleading
- As evidence of frequency or effect. Reporting "we observed 3 cases" with no denominator and treating it as an incidence, or implying causality from a single temporal association, is the classic abuse. A case report cannot rule out coincidence, confounding by indication, or progression of the underlying disease.
- When a comparative design is feasible and the question is comparative. Publishing a case report of an outcome that a powered cohort could actually study substitutes anecdote for evidence and can entrench a false signal that later studies waste resources refuting.
- As a denominator-free safety claim in a regulatory submission. Case reports support hypothesis generation and causality narratives; they do not establish risk magnitude and cannot anchor a labeling change on their own.
- When consent/de-identification is impossible. A single patient is inherently identifiable from a rich timeline plus rare diagnosis plus dates; HIPAA-compliant de-identification and documented informed consent are mandatory, and IRB or privacy-board review is often required even though the study is "just one patient."
Data-source operational depth
In RWD, claims/EHR/registry play two distinct roles: (a) case-finding — efficiently flagging chart-review candidates from millions of records — and (b) narrative source — supplying the clinical detail the report ultimately needs. They are good at very different things.
- Claims (FFS or commercial): Excellent for screening (rare diagnosis code + specific NDC within a defined window after dispensing + continuous enrollment + no prior history of the event), poor for narrative (no labs, notes, imaging, or causality detail). Failure modes: Medicare Advantage and capitated person-time drop fee-for-service claims, so an apparent "no prior event" can be missingness rather than a true negative history — restrict screening to enrollees with observable A/B/D (or commercial medical+pharmacy) across the full lookback. `days_supply` and 90-day mail-order distort the exposure timeline; claim reversals and coordination-of-benefits create phantom or duplicated exposures; place of service matters for infused biologics (outpatient admin vs inpatient). Always pull the chart before believing a claims-only case.
- EHR: The primary narrative source — notes, problem lists, labs, pathology, imaging, exact dosing/administration, and patient-reported outcomes — and the right substrate for documenting dechallenge/rechallenge with serial labs. Limit: visit-driven capture means care delivered outside the system is invisible, so a "complete" EHR timeline may have silent gaps; NLP or manual abstraction is needed to assemble the CARE timeline.
- Registry (device, pregnancy, rare disease): Often mandates case reporting for enrolled patients and is strong for indication, severity, and adjudicated outcomes; typically weak for full pharmacy exposure. Pregnancy registries with mother-infant linkage enable reports on in-utero exposure outcomes that no single data source captures alone.
- Linked claims-EHR-vital-records: The ideal substrate — claims completeness for exposure/utilization, EHR for the adjudicated narrative, and a death index for fatal outcomes — but report the linkage quality and any date discrepancies among order, fill, and service dates.
Worked claims example — suspected drug-induced liver injury (DILI)
Goal: surface chart-review candidates for a case report of acute hepatocellular injury after initiation of a hepatotoxic agent, e.g., a newly marketed kinase inhibitor.
- Index exposure: first pharmacy fill of any NDC on the drug's list (`fill_date` = candidate index date); the patient must be a new user — no fill of that NDC in the prior 180 days.
- Continuous, observable enrollment: require 365 days of continuous medical + pharmacy FFS-observable enrollment before the index fill (so absence of prior liver disease is real, not unobserved), and at least 90 observable days after it.
- Clean lookback: no diagnosis of chronic liver disease, viral hepatitis, alcoholic liver disease, or biliary obstruction in the 365-day baseline, and no dispensing of a known competing hepatotoxin (e.g., high-dose acetaminophen, isoniazid, methotrexate) in the 30 days around index.
- Outcome window: a new diagnosis of acute hepatocellular/hepatic injury (relevant ICD-10 codes) within 90 days after the index fill — the latency window appropriate to idiosyncratic DILI.
- Output: a short candidate list (typically a handful of patients), each flagged for chart review of LFT trajectories (ALT/AST/alkaline phosphatase/bilirubin), R-ratio, exclusion of alternative causes, and — critically — any documented dechallenge (LFTs normalizing after stopping the drug) or inadvertent rechallenge. The claims query does not establish causality; its only job is to find the patient whose adjudicated timeline becomes the CARE-structured report and feeds downstream pharmacovigilance and, if a pattern emerges, a formal comparative study.
Decision diagram
flowchart TD
  Src[RWD source: claims / EHR / registry] --> Screen[Case-finding screen<br/>rare outcome dx + specific NDC<br/>in latency window post-dispense]
  Screen --> Elig[New user + continuous observable enrollment<br/>+ clean baseline for event and competing causes]
  Elig --> Pull[Pull chart / EHR narrative:<br/>labs, imaging, notes, exact dosing]
  Pull --> Adj[Adjudicate causality:<br/>timeline, alternative explanations,<br/>dechallenge / rechallenge]
  Adj --> Care[Assemble CARE-structured report<br/>+ informed consent + de-identification]
  Care --> Out[Contribute to case series / registry<br/>/ pharmacovigilance signal evaluation]
gantt
  title Case-report timeline for one patient (DILI example)
  dateFormat YYYY-MM-DD
  axisFormat %b %Y
  section Baseline
  Clean lookback: no chronic liver disease, observable enrollment :done, base, 2024-01-01, 2024-12-31
  section Index
  First fill of suspect drug (incident exposure) :milestone, t0, 2025-01-01, 0d
  section On-treatment
  Suspect drug exposure :active, exp, 2025-01-01, 60d
  section Outcome and challenge
  Acute liver injury onset (within latency window) :crit, ev, 2025-02-20, 1d
  Drug stopped; LFTs normalize (dechallenge) :done, dech, 2025-03-01, 30d
Worked example
Scenario
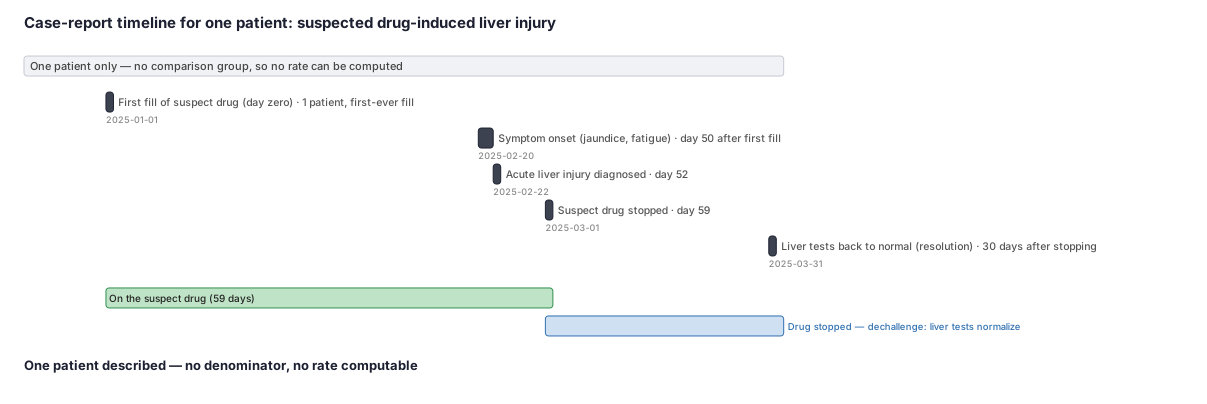
One adult patient starts a newly marketed cancer drug on January 1, 2025 — their first-ever fill of it, with no liver problems in the year before. About seven weeks later they develop sudden liver injury. The drug is stopped, and their liver tests return to normal over the next month. We want to write up exactly what happened to this one person. Notice what we are NOT doing: we are not asking how often this happens or whether the drug causes liver injury in general, because we have one patient and no comparison group.
Dataset
The patient's event log — the kind of date-and-event rows an analyst pulls from the chart and claims to build a timeline. One patient, listed in time order.
| person_id | date | event |
|---|---|---|
| 4471 | 2024-01-01 | Continuous insurance coverage begins (clean year, no liver disease on record) |
| 4471 | 2025-01-01 | First fill of suspect cancer drug (day zero for this patient) |
| 4471 | 2025-02-20 | Symptom onset: jaundice and fatigue; liver tests sharply elevated |
| 4471 | 2025-02-22 | Acute liver injury diagnosed |
| 4471 | 2025-03-01 | Suspect drug stopped |
| 4471 | 2025-03-31 | Liver tests back to normal (resolution) |
Steps
Result
This is a description of ONE patient (person 4471), not a measurement. The timeline shows a clean year, a first drug fill on day zero, liver injury 50 days later, and recovery once the drug stopped. There is no denominator, so no rate, risk, or percentage exists — the report's value is the detailed, credible story and the question it raises, not any number.
Trade-offs
Runnable example
Case-FINDING screen for a drug-induced-liver-injury (DILI) case report. This does NOT estimate anything; it returns a short list of chart-review candidates for adjudication. Required inputs (cleaned, de-duplicated): rx : pharmacy fills -> person_id, fill_date (datetime64), ndc, drug_group ('TARGET' for the suspect...
import pandas as pd

LOOKBACK_DAYS = 365   # clean-baseline + observable-time requirement before index
NEWUSER_DAYS  = 180   # no prior target-drug fill within this window => incident exposure
LATENCY_DAYS  = 90     # idiosyncratic DILI onset window after first dispense
FOLLOWUP_DAYS = 90     # minimum observable follow-up to see (or rule out) the event

def find_dili_candidates(rx: pd.DataFrame, dx: pd.DataFrame, enroll: pd.DataFrame) -> pd.DataFrame:
    rx = rx.sort_values(["person_id", "fill_date"])

    # Index = first fill of the suspect (TARGET) drug.
    target = rx[rx["drug_group"] == "TARGET"]
    idx = (target.groupby("person_id", as_index=False)["fill_date"].min()
                 .rename(columns={"fill_date": "index_date"}))

    # New-user: drop anyone with a TARGET fill in the NEWUSER_DAYS before their index date.
    t = target.merge(idx, on="person_id")
    prior = t[(t["fill_date"] < t["index_date"]) &
              (t["fill_date"] >= t["index_date"] - pd.Timedelta(days=NEWUSER_DAYS))]
    idx = idx[~idx["person_id"].isin(prior["person_id"])].copy()

    # Continuous, FFS-observable enrollment across full lookback through index + minimum follow-up (no MA-only gaps).
    e = enroll.merge(idx, on="person_id")
    covers = ((e["enroll_start"] <= e["index_date"] - pd.Timedelta(days=LOOKBACK_DAYS)) &
              (e["enroll_end"]   >= e["index_date"] + pd.Timedelta(days=FOLLOWUP_DAYS)) &
              (~e["ma_only"]))
    idx = idx[idx["person_id"].isin(e.loc[covers, "person_id"])].copy()

    # Clean baseline: exclude pre-existing chronic liver disease in the 365-day lookback.
    cl = dx[dx["dx_group"] == "CHRONIC_LIVER"].merge(idx, on="person_id")
    chronic = cl[(cl["dx_date"] < cl["index_date"]) &
                 (cl["dx_date"] >= cl["index_date"] - pd.Timedelta(days=LOOKBACK_DAYS))]
    idx = idx[~idx["person_id"].isin(chronic["person_id"])].copy()

    # Clean baseline: exclude a competing hepatotoxin dispensed within +/-30 days of index.
    hep = rx[rx["drug_group"] == "HEPATOTOXIN"].merge(idx, on="person_id")
    confounded = hep[(hep["fill_date"] >= hep["index_date"] - pd.Timedelta(days=30)) &
                     (hep["fill_date"] <= hep["index_date"] + pd.Timedelta(days=30))]
    idx = idx[~idx["person_id"].isin(confounded["person_id"])].copy()

    # Outcome: NEW acute liver injury within the latency window after index.
    li = dx[dx["dx_group"] == "LIVER_INJURY"].merge(idx, on="person_id")
    events = li[(li["dx_date"] > li["index_date"]) &
                (li["dx_date"] <= li["index_date"] + pd.Timedelta(days=LATENCY_DAYS))]
    first_event = events.groupby("person_id", as_index=False)["dx_date"].min() \
                        .rename(columns={"dx_date": "event_date"})

    candidates = idx.merge(first_event, on="person_id")
    candidates["days_to_event"] = (candidates["event_date"] - candidates["index_date"]).dt.days
    # Hand off to chart review (LFT trajectory, R-ratio, alternative causes, dechallenge/rechallenge).
    return candidates[["person_id", "index_date", "event_date", "days_to_event"]] \
               .sort_values("days_to_event").reset_index(drop=True)
Case-FINDING screen for a DILI case report, data.table. Inputs mirror the Python version: rx : person_id, fill_date (Date), ndc, drug_group ('TARGET'/'HEPATOTOXIN') dx : person_id, dx_date (Date), icd10, dx_group ('LIVER_INJURY'/'CHRONIC_LIVER') enroll : person_id, enroll_start, enroll_end, ma_only (logical) Returns...
library(data.table)
LOOKBACK <- 365L; NEWUSER <- 180L; LATENCY <- 90L; FOLLOWUP <- 90L

find_dili_candidates <- function(rx, dx, enroll) {
  setDT(rx); setDT(dx); setDT(enroll)

  # Index = first fill of the suspect (TARGET) drug.
  idx <- rx[drug_group == "TARGET", .(index_date = min(fill_date)), by = person_id]

  # New-user: drop anyone with a TARGET fill within NEWUSER days before index.
  t <- merge(rx[drug_group == "TARGET"], idx, by = "person_id")
  prior_ids <- unique(t[fill_date < index_date & fill_date >= index_date - NEWUSER, person_id])
  idx <- idx[!person_id %chin% prior_ids]

  # Continuous FFS-observable enrollment across lookback through index + minimum follow-up.
  e <- merge(enroll, idx, by = "person_id")
  ok <- e[enroll_start <= index_date - LOOKBACK &
          enroll_end   >= index_date + FOLLOWUP & !ma_only, unique(person_id)]
  idx <- idx[person_id %chin% ok]

  # Clean baseline: no chronic liver disease in lookback.
  cl <- merge(dx[dx_group == "CHRONIC_LIVER"], idx, by = "person_id")
  chronic_ids <- unique(cl[dx_date < index_date & dx_date >= index_date - LOOKBACK, person_id])
  idx <- idx[!person_id %chin% chronic_ids]

  # Clean baseline: no competing hepatotoxin within +/-30 days of index.
  hep <- merge(rx[drug_group == "HEPATOTOXIN"], idx, by = "person_id")
  conf_ids <- unique(hep[fill_date >= index_date - 30L & fill_date <= index_date + 30L, person_id])
  idx <- idx[!person_id %chin% conf_ids]

  # Outcome: new acute liver injury within the latency window after index.
  li <- merge(dx[dx_group == "LIVER_INJURY"], idx, by = "person_id")
  ev <- li[dx_date > index_date & dx_date <= index_date + LATENCY,
           .(event_date = min(dx_date)), by = .(person_id, index_date)]
  ev[, days_to_event := as.integer(event_date - index_date)]
  setorder(ev, days_to_event)
  ev[, .(person_id, index_date, event_date, days_to_event)]   # -> chart review
}
Case-FINDING screen for a DILI case report in SAS, mirroring the Python/R logic with PROC SQL set operations (no estimation procedure is appropriate for a case report). Required input datasets (post data-management): work.rx : person_id, fill_date, ndc, drug_group ('TARGET'/'HEPATOTOXIN') work.dx : person_id,...
%let lookback = 365; %let newuser = 180; %let latency = 90; %let followup = 90;

/* Index = first fill of the suspect (TARGET) drug. */
proc sql;
  create table idx as
  select person_id, min(fill_date) as index_date format=date9.
  from work.rx
  where drug_group = 'TARGET'
  group by person_id;
quit;

/* New-user: drop anyone with a prior TARGET fill within the new-user window before index. */
proc sql;
  create table newuser as
  select i.* from idx i
  where not exists (
    select 1 from work.rx r
    where r.person_id = i.person_id and r.drug_group = 'TARGET'
      and r.fill_date <  i.index_date
      and r.fill_date >= i.index_date - &newuser
  );
quit;

/* Continuous FFS-observable enrollment across lookback through index + minimum follow-up (no MA-only spans). */
proc sql;
  create table enrolled as
  select n.* from newuser n
  where exists (
    select 1 from work.enroll e
    where e.person_id = n.person_id and e.ma_only = 0
      and e.enroll_start <= n.index_date - &lookback
      and e.enroll_end   >= n.index_date + &followup
  );
quit;

/* Clean baseline: no chronic liver disease in lookback AND no competing hepatotoxin within +/-30 days of index. */
proc sql;
  create table clean as
  select c.* from enrolled c
  where not exists (
          select 1 from work.dx d
          where d.person_id = c.person_id and d.dx_group = 'CHRONIC_LIVER'
            and d.dx_date <  c.index_date
            and d.dx_date >= c.index_date - &lookback)
    and not exists (
          select 1 from work.rx h
          where h.person_id = c.person_id and h.drug_group = 'HEPATOTOXIN'
            and h.fill_date between c.index_date - 30 and c.index_date + 30);
quit;

/* Outcome: new acute liver injury within the latency window after index -> chart-review candidates. */
proc sql;
  create table candidates as
  select c.person_id, c.index_date,
         min(d.dx_date) as event_date format=date9.,
         min(d.dx_date) - c.index_date as days_to_event
  from clean c
  inner join work.dx d
    on d.person_id = c.person_id and d.dx_group = 'LIVER_INJURY'
   and d.dx_date >  c.index_date
   and d.dx_date <= c.index_date + &latency
  group by c.person_id, c.index_date
  order by days_to_event;
quit;
Citations
- [1]ENCePP Guide on Methodological Standards in Pharmacoepidemiology. European Medicines Agency / ENCePP.
- [2]Gagnier JJ, Kienle G, Altman DG, Moher D, Sox H, Riley D. The CARE guidelines: consensus-based clinical case report guideline development. Journal of Medical Case Reports. 2013;7:223.
- [3]Aronson JK. Anecdotes as evidence: we need guidelines for reporting anecdotes of suspected adverse drug reactions. BMJ. 2003;326(7403):1346.