Provider-Profiling Funnel Plot
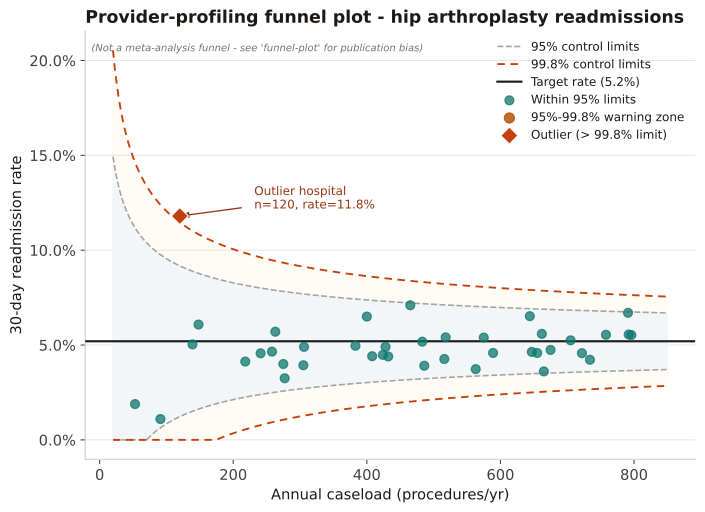
A statistical process control chart that plots each institution's observed (indirectly standardized) event rate against its caseload. Hyperbolic 95% and 99.8% control limits narrow with increasing volume; institutions outside the 99.8% band are flagged as statistical outliers warranting review.
To identify high- or low-performing institutions (hospitals, surgical centres, prescribers) in quality-of-care or outcomes research. Event rates should be indirectly standardized for casemix before plotting. Requires sufficient caseload per institution to have meaningful statistical power.
Institutions inside the 95% limits are within expected random variation. Institutions between 95% and 99.8% bands warrant monitoring. Institutions beyond the 99.8% limits are statistical outliers at the three-sigma level — a signal for deeper casemix review, data-quality audit, or quality-improvement investigation. Volume-dependent limits mean that low-volume institutions can have wide bands and are harder to classify.
40 hospitals reporting 30-day readmission after elective hip arthroplasty. Overall (target) rate p₀ = 5.2% (0.052). Caseloads range 50–800/yr. Control limits at each caseload n: 95%: p₀ ± 1.96√(p₀(1−p₀)/n); 99.8%: p₀ ± 3.09√(p₀(1−p₀)/n).
Result: One hospital (n=120) exceeds the 99.8% upper control limit (observed 11.8% vs limit 11.5%), flagged as a high-rate outlier. No hospitals fall between the 95% and 99.8% bands. The remaining 39 hospitals fall within expected variation.
Reference: Gatto NM, Wang SV, Murk W, et al. Visualizations throughout pharmacoepidemiology study planning, implementation, and reporting. Pharmacoepidemiol Drug Saf. 2022;31(11):1140-1152.