LEARN / LEARNING PATHS

Seven tracks through RWE & HEOR methods

Every concept in the repository has prerequisites. These tracks surface those dependencies as deliberate sequences — so you never encounter a formula before its foundations. Each step links the full concept entry and explains in one line why it comes next.

7 tracks 74 steps Every step links to a live repository entry. Beginner layer included on every entry
TRACK 01

Claims Data Foundations

12 steps · ~6–8 hrs · Beginner-friendly
Companion visual: Claim Forms annotated reference
01
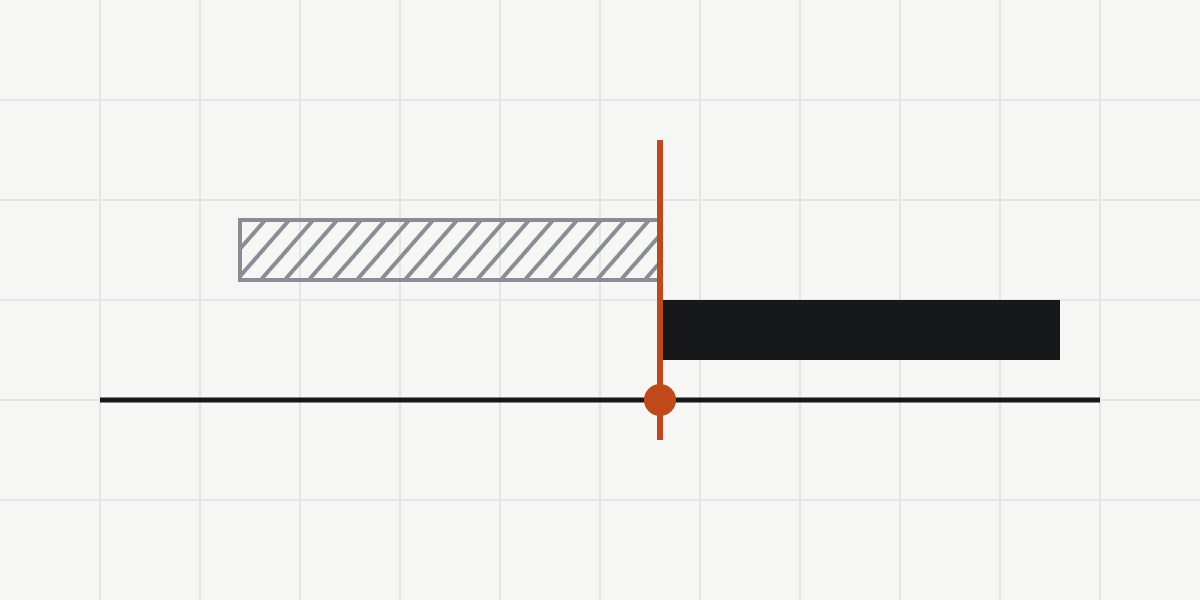
Study Time Windows Anatomy
The temporal skeleton every claims analysis is built on — start here before touching any code field.
02
ICD-10-CM Diagnosis Coding
Diagnosis codes define your outcome and comorbidities — understand hierarchy before building phenotypes.
03
CPT Procedure Coding
Procedures anchor treatment exposure in professional claims; pairs directly with ICD codes on the same claim line.
04
NDC — National Drug Code
Drug exposure lives in NDCs on pharmacy claims; required before tackling dispensing-based cohort entry.
05
NCPDP Pharmacy Claim Fields
Maps NDCs onto the NCPDP transaction format — needed to extract days supply, quantity, and refill data.
06
UB-04 Institutional Claim Fields
Inpatient and outpatient facility claims travel on UB-04 — understanding its structure is required for any hospital-based outcome.
07
CMS-1500 Professional Claim Fields
Physician services ride the CMS-1500; links CPT codes to place of service and billing provider.
08
Revenue Center Codes
Revenue codes on UB-04 distinguish emergency, observation, and ICU encounters — critical for site-of-care phenotyping.
09
Claim Adjustments, Reversals & Denials
Failure to handle adjustment/void claim lines creates ghost utilization — must be cleaned before any analysis.
10
Continuous Enrollment & Observable Time
Gaps in coverage = gaps in data; defining eligible observation time is the gatekeeper for all downstream denominators.
11
Washout / Clean Lookback Period
Washout windows ensure new-user and drug-naïve cohorts — the prerequisite for credible exposure classification.
12
Diagnosis Phenotype Algorithm (1IP/2OP)
Combines every prior step into a validated cohort-entry rule — the capstone of claims-based cohort construction.
TRACK 02

Statistics On-Ramp

12 steps · ~8–10 hrs · Beginner-friendly
01
Descriptive Statistics
Mean, median, IQR — the vocabulary every table-1 and every subsequent test assumes you already know.
02
Normal Distribution & CLT
The central limit theorem is why most parametric tests work on large RWE samples even with skewed raw data.
03
Inferential Statistics Foundations
p-values, confidence intervals, and the null-hypothesis framework underpin every comparison you will run.
04
Maximum Likelihood Estimation
MLE is the engine inside every regression model you will use — understanding it demystifies model fitting.
05
Parametric vs. Nonparametric Tests
Knowing when normality assumptions break guides whether you reach for t-tests or rank-based alternatives.
06
Two-Sample t-Test
The workhorse for comparing continuous baseline covariates between treatment arms in Table 1.
07
Chi-Square Test
The analogous test for categorical variables — essential for comparing demographic and binary covariate distributions.
08
Risk Ratio & Risk Difference
The two fundamental measures of comparative effect — every HEOR model uses one or both as its currency.
09
Binomial Distribution & Logit Link
Binary outcomes (hospitalisation, event) follow the binomial; the logit link maps probabilities onto the real line for regression.
10
OLS Linear Regression
The intuition and matrix algebra behind OLS transfers directly to GLMs and survival models.
11
Generalized Linear Models
GLMs unify logistic, Poisson, and gamma regression under one framework — the workhorse of outcomes research.
12
Regression Diagnostics
Residual plots, leverage, and VIF reveal whether your model assumptions hold before you trust its estimates.
TRACK 03

Study Design

8 steps · ~6–8 hrs · Prereq: Tracks 01–02
01
Retrospective Cohort Study
The default RWE frame: define exposure, then follow forward to the outcome. Every other design is a refinement on this.
02
New-User (Incident User) Design
Start follow-up at treatment initiation so prevalent-user survivor bias never enters the cohort.
03
Active Comparator, New-User Design
Pair the new-user rule with a clinically similar comparator to blunt confounding by indication.
04
Case-Control Study
When the outcome is rare, sample on the outcome and look backward at exposure for efficiency.
05
Nested Case-Control
Draw the case-control sample inside a defined cohort to keep the sampling frame explicit and unbiased.
06
Self-Controlled Case Series
Let each person serve as their own control to remove all time-fixed confounding by design.
07
Immortal Time Bias Handling
The classic design trap: misclassified person-time that makes treatment look protective. Design it out from the start.
08
Target Trial Emulation
Specify the randomized trial you would have run, then emulate each protocol element in the observational data.
TRACK 04

Survival Analysis

10 steps · ~6–8 hrs · Prereq: Track 02
01
Censoring Mechanisms
Right censoring, left truncation, informative censoring — the defining quirks of time-to-event data in RWE.
02
Person-Time Denominator Construction
How to accumulate and truncate at-risk time in claims data — the denominator every incidence rate depends on.
03
Incidence Rate Calculation
Events per person-year is the universal rate measure; practice computing it before fitting any model.
04
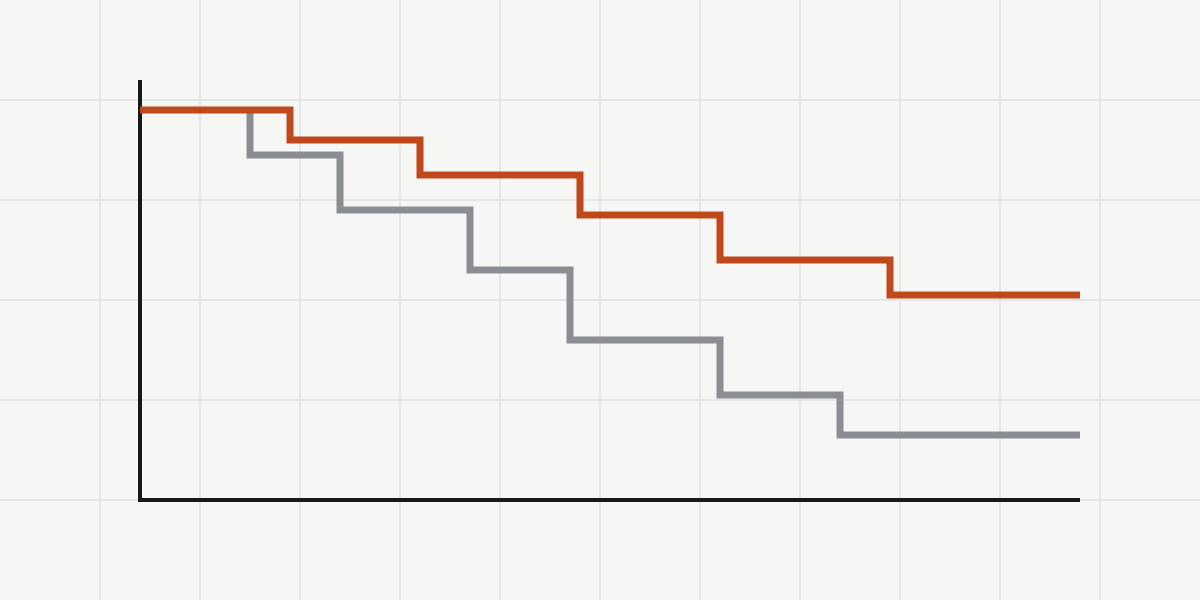
Kaplan-Meier Estimator
Non-parametric survival curves — the first visual every reviewer expects and the baseline every model is judged against.
05
Log-Rank Test
Tests equality of KM curves across groups — needed before deciding whether a Cox model is warranted.
06
Hazard Ratio Interpretation
HR ≠ relative risk; understanding the instantaneous-rate framing prevents the most common HTA submission error.
07
Cox PH Regression
The semi-parametric workhorse of time-to-event analyses in pharma RWE — assumes proportional hazards, which must be verified.
08
Competing Risks — Cause-Specific & Fine-Gray
Death before the outcome of interest invalidates standard KM; Fine-Gray subdistribution HR is the HTA-preferred alternative.
09
Accelerated Failure Time Models
Parametric alternative when proportional hazards fails — and the basis for survival extrapolation in economic models.
10
Restricted Mean Survival Time (RMST)
HR-free summary of survival benefit over a defined horizon — increasingly required by HTA bodies when PH fails.
TRACK 05

Causal Inference

12 steps · ~8–10 hrs · Prereq: Tracks 01–04
01
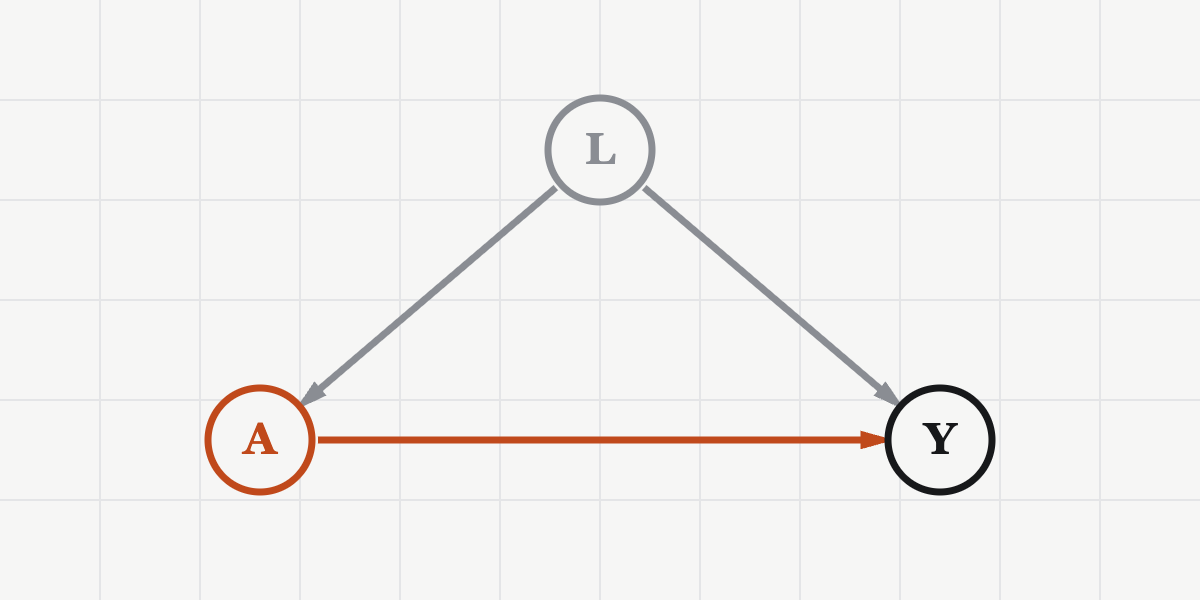
DAGs & Backdoor Criterion in Drug Studies
Directed acyclic graphs make confounding assumptions explicit — the foundation before any adjustment strategy.
02
Confounding by Indication & Channeling
The dominant bias in pharmacoepidemiology — sicker patients get treated, which inflates or deflates effect estimates.
03
New-User Design
Restricting to treatment initiators eliminates prevalent-user bias — the modern standard for drug comparisons in RWE.
04
Active Comparator + New-User Design
Pairing active comparators with new-user entry balances measured confounders and reflects real prescribing decisions.
05
Time-Zero / Index Date Alignment
Misaligned index dates introduce immortal time; correct anchoring is non-negotiable for valid follow-up.
06
Immortal Time Bias Handling
Time between cohort entry and treatment start cannot be spent having the outcome — mis-handling this inflates efficacy.
07
Propensity Score Methods (PSM / IPTW)
Matching and weighting on PS is the primary tool for reducing measured confounding in large claims databases.
08
Overlap Weights & Modern PS Weighting
Overlap weights outperform ATE/ATT weights in sparse-overlap settings common in specialty-drug RWE.
09
G-Computation / Parametric G-Formula
Standardisation via outcome regression — avoids PS trimming losses and handles time-varying confounders.
10
Target Trial Emulation
Formalises the hypothetical RCT your observational study is trying to answer — the FDA/EMA preferred framing.
11
E-Value Sensitivity Analysis
Quantifies how strong unmeasured confounding must be to explain away your result — required for any regulatory submission.
12
Quantitative Bias Analysis Toolkit
Goes beyond E-values to model misclassification and selection bias jointly — the advanced bias-analysis capstone.
TRACK 06

HEOR & Economic Modeling

10 steps · ~6–8 hrs · Prereq: Tracks 02 & 04
01
Healthcare Costs — PPPM / PPPY / PMPM
Per-member cost metrics are the lingua franca of payer communications and the raw input to budget impact models.
02
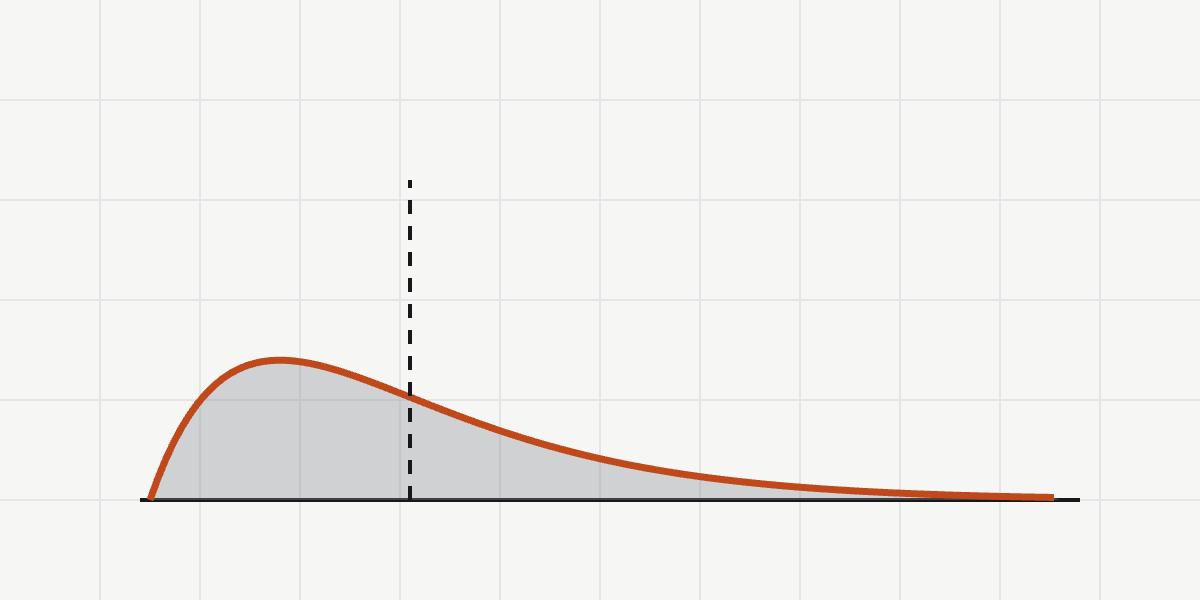
Gamma Distribution
Healthcare costs are right-skewed and strictly positive — gamma GLMs are the appropriate parametric model.
03
Two-Part Models for Semicontinuous Costs
Zero-inflated cost distributions need a logistic first part (any utilisation?) and a gamma second part (how much?).
04
Bootstrap Resampling Methods
Non-parametric CIs for cost differences and NMB estimates when distributional assumptions can't be verified.
05
QALY & Utility Mapping from RWE
Mapping condition-specific PROs to EQ-5D index scores is the bridge between RWE data and NICE/HTA cost-utility models.
06
Markov Transition Probabilities from RWE
How to derive state-transition parameters from observed data — the central plumbing of Markov cohort models.
07
Survival Extrapolation for HTA
Parametric extrapolation beyond the trial horizon is required by every NICE TA — RWE informs the long-run tail.
08
ICER & Net Monetary Benefit
The decision metric for cost-effectiveness: ICER vs. threshold, and NMB as the linear transformation for regression.
09
Probabilistic Sensitivity Analysis
Monte Carlo PSA propagates joint parameter uncertainty to the cost-effectiveness plane — required in every HTA dossier.
10
Budget Impact Analysis
Payer-facing affordability analysis; complements the cost-utility model and is required for most formulary submissions.
TRACK 07

Prediction & AI

10 steps · ~6–8 hrs · Prereq: Track 02
01
Predictive & Causal ML Models in RWE
Frames the prediction vs. causal distinction before diving into specific algorithms — avoids conflating the two goals.
02
Cross-Validation & Overfitting
k-fold CV is the standard guard against overfitting in high-dimensional claims data — required before tuning any model.
03
Regularized Regression — LASSO & Ridge
Penalised regression handles thousands of ICD/CPT indicators without overfitting; LASSO gives automatic variable selection.
04
Tree-Based Ensembles in RWE
Random forests and gradient boosting capture non-linear interactions that linear models miss in heterogeneous patient populations.
05
ROC, AUC & Discrimination
C-statistic measures how well the model ranks patients — the primary metric for algorithm validation studies.
06
Brier Score & Calibration
Calibration (does predicted probability match observed frequency?) is as important as discrimination for clinical decision support.
07
Prediction Model Validation & Recalibration
External validation and recalibration ensure the model performs in a new population — required before clinical deployment.
08
NLP for Clinical Text Extraction
Structured claims miss nuance captured in physician notes; NLP unlocks smoking status, severity, and disease course from EHR text.
09
LLM-Assisted Abstraction in RWE
Large language models as chart-abstraction tools — covers prompt design, hallucination risk, and regulatory validation requirements.
10
Agreement Statistics — Kappa, ICC, Bland-Altman
Measures inter-rater reliability between NLP/LLM output and human abstraction — the final gate before algorithm acceptance.