NMA Contribution and Direct-Indirect Agreement
Assumed model-output examples show which studies contribute and how direct and indirect estimates compare.
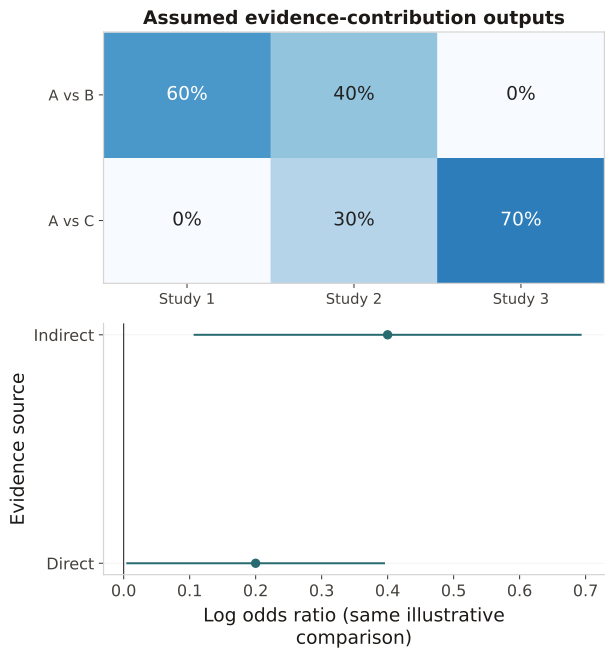
Use model-derived contribution and inconsistency outputs from the actual network. This plotting example does not fit an NMA or compute contributions.
Illustrative contribution rows are (60%,40%,0%) and (0%,30%,70%). Direct log OR is .2 (SE .1); indirect log OR is .4 (SE .15). Overlapping intervals do not prove network consistency.
Assumed model-output examples show which studies contribute and how direct and indirect estimates compare.
Result: Use model-derived contribution and inconsistency outputs from the actual network. This plotting example does not fit an NMA or compute contributions.
Reference: Primary method sources are listed in the linked producing-method entries. The displayed data are original synthetic teaching examples, not published patient results.