Spline Dose–Response Curve (Restricted Cubic Spline)
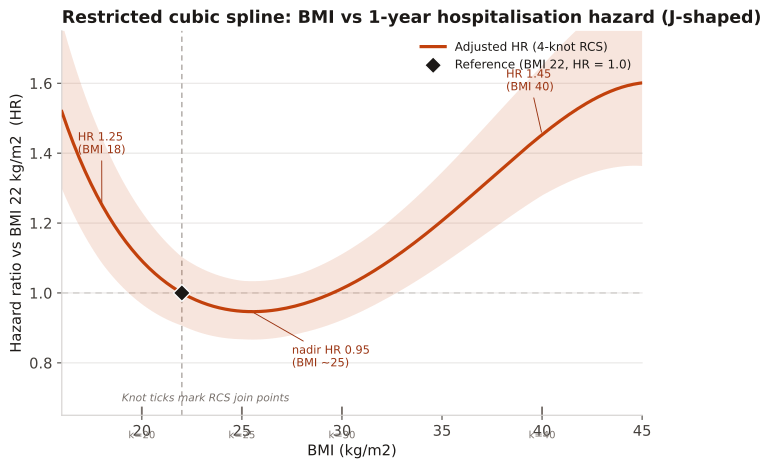
Displays the association between a continuous exposure (e.g. BMI, cumulative drug dose) and an outcome (e.g. hospitalisation hazard ratio) as a smooth restricted cubic spline with 95% confidence band, a reference value marked at HR=1, and vertical tick marks at the knot positions.
When a continuous exposure may have a non-linear association with the outcome and you want to avoid arbitrary categorisation. Use restricted cubic splines (RCS / natural splines) with 3–5 knots (Harrell recommends 4 or 5 placed at fixed quantiles). Always state the reference value and report the knot positions.
The curve shows the log-hazard ratio (exponentiated to the HR scale) relative to the reference value. Where the CI band excludes HR=1 the association is statistically significant. Knot tick marks indicate where the piecewise cubic polynomials are joined; the curve is constrained to be linear beyond the outer knots (the 'restricted' property). A J-shape indicates a low-exposure nadir with risk rising on both sides.
A Cox model fit to 18 500 claims-identified patients estimates the association between baseline BMI (kg/m²) and 1-year hospitalisation hazard, adjusted for age, sex, Charlson score and statin use. A 4-knot RCS is used with knots at BMI 20, 25, 30, 40 kg/m². Reference BMI = 22 kg/m² (HR ≡ 1.0). The fitted log-HR on a fine grid is exponentiated to give HR(BMI) with a 95% CI band.
Result: The association is J-shaped: HR falls from 1.25 at BMI 18 to a nadir of 0.95 at BMI ≈ 25, then rises to 1.45 at BMI 40. The nadir HR of 0.95 at BMI 25 vs reference BMI 22: log(0.95) = −0.051; exp(−0.051) = 0.950. At BMI 40 vs 22: log(1.45) = 0.374; exp(0.374) = 1.454. The 95% CI at BMI 40 is approximately 1.45 × exp(±1.96 × 0.065) = (1.28, 1.65), confirming statistical significance.
Reference: Gatto NM, Wang SV, Murk W, et al. Visualizations throughout pharmacoepidemiology study planning, implementation, and reporting. Pharmacoepidemiol Drug Saf. 2022;31(11):1140-1152.