Volcano Plot (Many-Outcome Screening)
Screens many simultaneously-estimated associations by plotting effect size against −log₁₀(p), with a multiplicity-corrected threshold separating signals from noise.
For hypothesis-free or high-throughput analyses — drug-wide safety screening, many outcomes, or empirical covariate/exposure screens — where hundreds of estimates need triage with explicit multiplicity control.
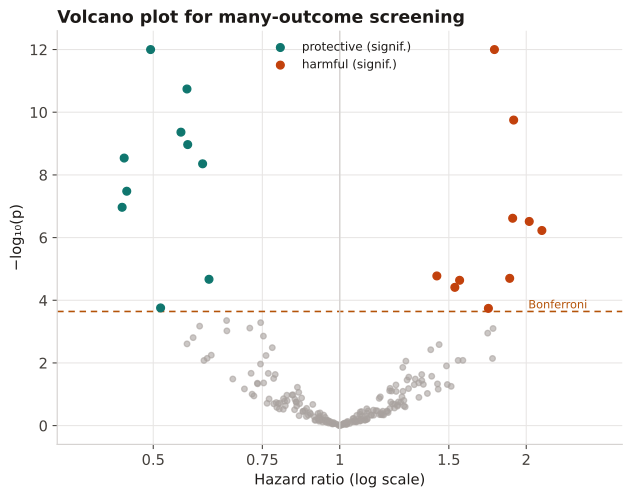
Each point is one association: x = effect (log HR/RR), y = −log₁₀(p). Points above the Bonferroni/FDR line and away from the null are candidate signals; the symmetry and the cloud of null results help judge residual systematic error.
220 outcome associations are each estimated as a log hazard ratio with a standard error; −log₁₀(p) is plotted against the log HR, and a Bonferroni threshold (0.05/220) separates signals from the null cloud.
Result: About 14 associations clear the Bonferroni line — splitting into protective (left) and harmful (right) signals — while the bulk form a symmetric null cloud near HR=1, suggesting limited systematic error and a manageable set of signals to follow up.
Reference: Gatto NM, Wang SV, Murk W, et al. Visualizations throughout pharmacoepidemiology study planning, implementation, and reporting. Pharmacoepidemiol Drug Saf. 2022;31(11):1140-1152.