Waterfall Plot (Tumor Response)
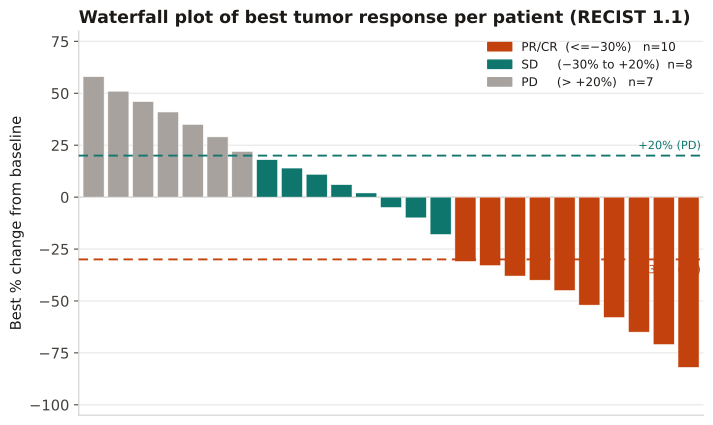
Per-patient best percentage change from baseline in target-lesion sum, sorted descending, with RECIST 1.1 response (−30%) and progression (+20%) thresholds shown as horizontal reference lines. Provides an individual-level view of anti-tumor activity that complements aggregate response rates.
Oncology efficacy analyses where target-lesion measurements are available per patient (clinical trial or registry-linked RWD). Use to display the full distribution of anti-tumor activity, reveal the mix of responders and progressors, and identify patients near RECIST thresholds. Requires at least one post-baseline measurement per patient.
Each bar is one patient; bar height = best % change from baseline (negative = shrinkage, positive = growth). The −30% line (vermilion dashed) is the RECIST 1.1 partial-response threshold; bars below it are responders (PR or CR). The +20% line (teal dashed) is the progressive-disease threshold. Bars between the two lines are stable disease. Color-coded bars make the three zones immediately visible.
25 oncology patients with target-lesion measurements at baseline and ≥1 post-baseline scan. Best percentage changes range from −82% (deepest responder) to +58% (strongest progressor). 10 patients achieve PR (≤−30%), 8 have SD (−30% to +20%), 7 have PD (>+20%). Bars are sorted descending (most positive left, most negative right).
Result: Response rate = 10/25 = 40% (PR; no CR in this cohort). Stable disease = 8/25 = 32%. Progressive disease = 7/25 = 28%. Median best change = −5% (13th bar, in the SD zone). These counts and the bar heights are directly visible in the rendered SVG (sorted data: 10 bars at or below −30%, 8 bars in −30% to +20%, 7 bars above +20%).
Reference: Gatto NM, Wang SV, Murk W, et al. Visualizations throughout pharmacoepidemiology study planning, implementation, and reporting. Pharmacoepidemiol Drug Saf. 2022;31(11):1140-1152.