Prescription Sequence Symmetry Analysis (PSSA)
A self-controlled signal-detection method that tests whether one drug is dispensed disproportionately before or after a second drug (or event marker) among incident users of both, estimating an adjusted sequence ratio after correcting for background prescribing trends.
On this page
Prescription Sequence Symmetry Analysis (PSSA) is a drug-safety screening method that asks a simple question: among patients who were newly started on both a study drug (drug A) and a second drug that treats a known side-effect condition (drug B), did A tend to come before B far more often than B came before A? If the ordering were random, the two directions — A-then-B and B-then-A — would appear roughly equally often. A large excess of A-then-B patients is a signal that starting A may be triggering the condition that B treats. Because each patient serves as their own control, the method cancels out stable, between-person differences such as genetics or long-standing health conditions without ever having to measure them.
Prescription Sequence Symmetry Analysis (PSSA)
asks a deceptively simple question: among people who started both an index drug (A) and a marker drug or event (B), did A tend to come before B more often than B came before A? Under the sharp null of no causal relationship, and in the absence of any secular prescribing trend, the order should be symmetric — roughly half the discordant pairs would run A→B and half B→A.
An excess of A→B pairs is a signal that starting A may trigger the condition that B treats (a putative adverse drug event), where B is used as a proxy marker for the outcome. Because each person serves as their own control, PSSA cancels all time-invariant between-person confounders (genetics, chronic comorbidity, frailty, socioeconomic status) without measuring them — the same logic that powers the case-crossover and self-controlled case series, applied to two prescriptions instead of one exposure and one event.
Core estimand distinction
PSSA does not estimate a hazard ratio, risk ratio, or drug-vs-drug contrast. Its target is the sequence ratio (SR) = n(A→B) / n(B→A), the ratio of the count of incident users whose first A preceded their first B to the count whose first B preceded their first A (within a symmetric pre/post window). The SR is biased upward purely by growth in prescribing: if A's incidence is rising over calendar time, more A→B orderings appear for arithmetic reasons alone.
PSSA corrects this with the null-effect sequence ratio (NSR) — the SR expected under no causal effect, derived from the waiting-time distribution and the background incidence trends of the two drugs (Hallas's order-statistic / Tsiropoulos trend-modeling approach). The reported quantity is the adjusted sequence ratio (aSR) = SR / NSR, with an exact-binomial or asymptotic 95% CI on the underlying discordant-pair proportion.
The aSR is interpreted as a relative incidence of B in the period after A versus before A, under the assumption that within-person time-invariant confounding is constant and that the only systematic asymmetry beyond the causal effect is the prescribing trend captured by the NSR. An aSR meaningfully above 1 flags a potential adverse effect of A; an aSR below 1 can signal a protective effect or, more often, depletion/reverse-causation artifacts.
Interpreting the output
From the worked example: among incident dual users of thiazide diuretics (A) and gout therapy (B), n(A→B) = 1,820 and n(B→A) = 1,150. Crude SR = 1,820 / 1,150 = 1.58 (exact-binomial 95% CI approximately 1.47–1.71). After modeling background prescribing trends, NSR = 1.12. Adjusted sequence ratio aSR = 1.58 / 1.12 = 1.41 (95% CI approximately 1.31–1.53).
Formal interpretation: The aSR of 1.41 means that, after correcting for the secular trend in thiazide initiation (rising use generates excess A→B orderings by calendar time alone), thiazide initiators were dispensed a gout therapy in the period after their first thiazide at approximately 1.41 times the rate seen in the period before their thiazide initiation. Because each person serves as their own control, this comparison cancels all time-invariant between-person confounders. The temporal asymmetry is interpreted as a within-person relative incidence signal, not an absolute risk or a population-level causal effect.
The 95% CI is derived from the exact-binomial uncertainty on the proportion n(A→B) / [n(A→B) + n(B→A)].
Practical interpretation: The aSR of 1.41 is a positive pharmacovigilance signal consistent with thiazide-induced gout. It does not quantify the population-level excess risk of gout, cannot separate the effect from confounding by indication (conditions predisposing to both thiazide use and gout), and should not be treated as a magnitude estimate for regulatory or clinical decision-making. A time-trend caveat is mandatory: any omission of the NSR step — reporting the crude SR of 1.58 — conflates a pharmacovigilance signal with a rising-use artifact.
Pros, cons, and trade-offs
- vs cohort / active-comparator new-user designs: PSSA needs only dispensing dates for two drugs — no outcome adjudication, no covariate measurement, no comparator selection — so it is fast, cheap, and self-controlling for stable confounders, making it the workhorse of automated pharmacovigilance over national prescription registries. Cost: it answers only "is there an asymmetric temporal signal," not "what is the effect size in a target population." It cannot separate the effect of A from confounding by indication for B, and the aSR is not a transportable causal effect. Prefer a cohort/ACNU design when you need a defensible magnitude, an absolute risk, or a regulatory effectiveness claim.
- vs case-crossover (CCO): Both are self-controlled and cancel time-invariant confounders. CCO compares exposure in case windows vs control windows within cases of a defined outcome; PSSA uses a second prescription as a surrogate outcome marker and looks at the symmetry of two incident initiations. Prefer CCO when you have a sharply defined acute event and a known transient exposure; prefer PSSA for hypothesis-free screening of drug→drug(→event) signals where the outcome is operationalized by a treatment marker.
- vs self-controlled case series (SCCS): SCCS models the within-person incidence rate ratio of a recurrent/acute event across exposed vs unexposed person-time and handles multiple events and time-varying exposure formally; it requires a clean event definition and exposure windows. PSSA is far simpler and trend-robust via the NSR but is coarser (one ordering per person, no rate model). Prefer SCCS when you can define the event and want a rate ratio; prefer PSSA for rapid, scalable screening.
- vs disproportionality analysis on spontaneous reports: PSSA uses longitudinal dispensing data (real denominators, real timing) rather than voluntary reports, so it is far less subject to reporting bias and stimulated reporting, though it can only detect events whose treatment is itself a dispensed drug.
When NOT to use — and when it is actively misleading or dangerous
- The marker drug treats indications unrelated to the suspected event. If B is used for many conditions, an A→B asymmetry may reflect confounding by indication for B, not an effect of A. The signal is then a mirage. Diagnose with a negative-control marker drug that should show aSR ≈ 1.
- You skip the NSR / trend adjustment. A drug whose use is rising (a new launch, a guideline change) generates spurious A→B excess from calendar time alone. Reporting a crude SR as if it were causal is the single most common and most dangerous PSSA error.
- Either drug is used by prevalent (non-incident) users. PSSA requires the first dispensing of both A and B within the observation window with a clean washout; carrying prevalent users into the pair set destroys the symmetry logic and biases the SR unpredictably.
- A itself treats the condition that B marks (reverse causation), or induction is near-zero. If B is started to treat the very symptom that led to A, or if A and B are co-initiated for the same syndrome, the temporal ordering is meaningless. Very short symmetry windows let reverse-causation dominate.
- Channeling: the indication for B was already present when A was started. Then B was always going to follow A regardless of any causal effect; a negative-control marker is essential to rule this out.
- You over-interpret an aSR as a magnitude or a population effect. PSSA is a screen. Treating an aSR of 1.8 as "an 80% increase in risk" for decision-making, or generalizing it beyond the incident-pair population, is methodologically indefensible.
Data-source operational depth
- Claims (FFS + Part D / commercial pharmacy): Exposure for both A and B is the pharmacy claim (NDC + `fill_date`). Require continuous medical + pharmacy enrollment across the full washout so that the first observed fill is the true incident fill, not the first captured fill. Failure mode: Medicare Advantage and capitated person-time lack fee-for-service claims, so an MA-only interval hides earlier dispensings and manufactures a false "first" date — asymmetry can then reflect enrollment artifacts. Restrict to enrollees with both Parts A/B/D (or a commercial pharmacy benefit) and exclude MA-only person-time. Sample fills, 90-day mail-order, and free samples shift apparent initiation dates and must be reconciled.
- EHR: Initiation is the medication order, not the dispense; if A is captured at order time but B (treated elsewhere) is only captured when filled, ascertainment is asymmetric and biases the SR. Prefer linkage to pharmacy fills for both drugs, and treat patients who leave the system (visit-driven capture) as differentially censored.
- Registry: National prescription registries (Denmark, Sweden, Norway, Australia PBS) are the canonical PSSA substrate — near-complete dispensing, stable denominators, long lookback. Disease registries, by contrast, are usually weak for pharmacy and must be linked to dispensing data.
- Linked claims–EHR–registry: Strongest for confirming incident status across systems and for a clean marker definition, but linkage selection and order/fill/service date discrepancies must be reconciled before assigning the index/marker ordering, or the symmetry test is corrupted at the source.
Worked claims example
Question: does initiating a thiazide diuretic (A) trigger gout, using first dispensing of a gout therapy — allopurinol or colchicine (B) — as the event marker, in a commercial + Medicare FFS database.
- Eligibility: adults with ≥365 days of continuous medical + pharmacy enrollment, FFS-observable (exclude MA-only person-time).
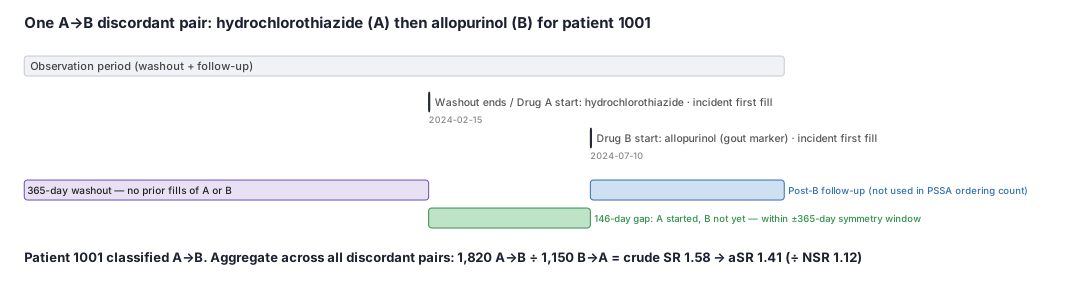
- Incident-pair set: keep persons whose first thiazide fill and first gout-therapy fill both fall inside a 3-year observation window, each preceded by a 365-day washout with no prior fill of that drug class.
- Symmetry window: count a pair as discordant if A and B initiations are within ±12 months of each other; classify as A→B (thiazide first) or B→A (gout therapy first).
Suppose n(A→B) = 1,820 and n(B→A) = 1,150. (4) Crude SR = 1820 / 1150 = 1.58, exact-binomial 95% CI on the proportion 1820/2970 = 0.613 → SR CI roughly 1.47–1.71. (5) NSR: model the background incidence trends of thiazide and gout-therapy initiation over the same calendar period (waiting- time / order-statistic approach); suppose rising thiazide use yields NSR = 1.12. (6) aSR = SR / NSR = 1.58 / 1.12 = 1.41 (95% CI ~1.31–1.53) — a clear positive signal consistent with the known thiazide–gout relationship. (7) Negative control: repeat with an unrelated marker (e.g., a topical dermatologic) that thiazides should not trigger; aSR ≈ 1 supports specificity. (8) Sensitivity: vary the symmetry window (±6, ±24 months), tighten the washout, and confirm the signal is not driven by co-initiation (reverse causation) at very short induction periods.
Decision diagram
flowchart TD
  Pop[Source population in dispensing data] --> Inc[Keep persons with FIRST incident fill of<br/>BOTH index drug A and marker drug B<br/>continuous-enrollment washout each]
  Inc --> Win{First A and first B<br/>within +/- symmetry window?}
  Win -- no --> Drop[Exclude pair]
  Win -- yes --> Ord{Which came first?}
  Ord -- A before B --> AB[Count A to B]
  Ord -- B before A --> BA[Count B to A]
  AB --> SR[Crude SR = n A->B / n B->A<br/>exact-binomial CI]
  BA --> SR
  SR --> NSR[Divide by null-effect sequence ratio<br/>from background prescribing trends]
  NSR --> ASR[Adjusted sequence ratio aSR<br/>signal if aSR and CI lower bound > 1]
ASR --> NC[Validate with negative-control marker<br/>expect aSR ~ 1]timeline
title One discordant incident pair (A before B) on the calendar
section Washout
365-day washout : no prior fill of A or B
section Index drug A
First fill of A (incident) : time of A initiation
section Induction
Gap within symmetry window : A precedes B -> counts as A to B
section Marker drug B
First fill of B (marker for the event) : B initiationWorked example
Scenario
A pharmacoepidemiology team wants to know whether starting a thiazide diuretic (a common blood-pressure drug, drug A) increases the risk of gout. Instead of looking for a gout diagnosis code, they use first-time dispensing of a gout therapy — allopurinol or colchicine — as the marker drug (drug B). They pull all adult patients in a large insurance claims database who started both a thiazide and a gout therapy for the first time within a three-year window, with no prior fills of either drug class in the preceding year. They then ask: in how many of these patients did the thiazide come first, and in how many did the gout therapy come first?
Dataset
Illustrative first-fill table — one row per drug per patient (the two rows for patient 1001 represent their one incident thiazide fill and their one incident gout-therapy fill).
| person_id | drug_role | drug_name | first_fill_date |
|---|---|---|---|
| 1001 | A (index) | hydrochlorothiazide | 2024-02-15 |
| 1001 | B (marker) | allopurinol | 2024-07-10 |
Steps
Result
- Label
Adjusted sequence ratio (aSR) = 1.41 (95% CI approximately 1.31–1.53) — a positive safety signal; A-before-B ordering is 41% more common than expected under no causal effect, consistent with thiazide triggering gout.
- Value
1.41
Trade-offs
Runnable example
PSSA from a claims-style first-fill table. Required input (already cleaned and de-duplicated): first_fill : person_id, drug (in {'A','B'}), first_date (datetime) -- the FIRST observed incident fill of each drug per person, after a continuous-enrollment washout.
import pandas as pd
from scipy.stats import binomtest

SYMMETRY_DAYS = 365   # |first_A - first_B| must be within this window to count as a pair

def pssa(first_fill: pd.DataFrame, nsr: float = 1.0) -> dict:
    # Pivot to one row per person with first_A and first_B (NaT if the drug was never started).
    wide = (first_fill.pivot_table(index="person_id", columns="drug",
                                   values="first_date", aggfunc="min"))
    pairs = wide.dropna(subset=["A", "B"]).copy()           # incident in BOTH drugs
    gap = (pairs["A"] - pairs["B"]).dt.days
    pairs = pairs[gap.abs() <= SYMMETRY_DAYS]               # within the symmetry window
    pairs = pairs[gap != 0]                                 # drop same-day (concordant) starts

    n_ab = int((pairs["A"] < pairs["B"]).sum())            # A started before B
    n_ba = int((pairs["B"] < pairs["A"]).sum())            # B started before A
    n = n_ab + n_ba
    sr = n_ab / n_ba if n_ba else float("inf")

    # Exact-binomial CI on the discordant proportion p = n_ab / n, mapped to SR = p / (1 - p).
    bt = binomtest(n_ab, n, 0.5)
    lo_p, hi_p = bt.proportion_ci(confidence_level=0.95)
    sr_lo, sr_hi = lo_p / (1 - lo_p), hi_p / (1 - hi_p)

    return {
        "n_AtoB": n_ab, "n_BtoA": n_ba, "n_discordant": n,
        "crude_SR": sr, "crude_SR_CI": (sr_lo, sr_hi),
        "NSR": nsr,
        "adjusted_SR": sr / nsr,
        "adjusted_SR_CI": (sr_lo / nsr, sr_hi / nsr),
    }
PSSA in R. The CohortSymmetry CRAN package is the canonical implementation against the OMOP common data model (it builds incident pairs, computes crude and adjusted sequence ratios, and handles the NSR). Below is a self-contained data.table version that mirrors the Python logic so the math is transparent.
library(data.table)

SYMMETRY_DAYS <- 365L

pssa <- function(first_fill, nsr = 1.0) {
  setDT(first_fill)
  wide <- dcast(first_fill, person_id ~ drug, value.var = "first_date", fun.aggregate = min)
  pairs <- wide[!is.na(A) & !is.na(B)]                       # incident in BOTH drugs
  pairs[, gap := as.integer(A - B)]
  pairs <- pairs[abs(gap) <= SYMMETRY_DAYS & gap != 0]       # within window, drop same-day

  n_ab <- pairs[A < B, .N]
  n_ba <- pairs[B < A, .N]
  n    <- n_ab + n_ba
  sr   <- if (n_ba > 0) n_ab / n_ba else Inf

  # Exact-binomial CI on the discordant proportion, mapped to the SR scale.
  bt   <- binom.test(n_ab, n, p = 0.5)
  p_ci <- bt$conf.int
  sr_lo <- p_ci[1] / (1 - p_ci[1]); sr_hi <- p_ci[2] / (1 - p_ci[2])

  list(n_AtoB = n_ab, n_BtoA = n_ba, n_discordant = n,
       crude_SR = sr, crude_SR_CI = c(sr_lo, sr_hi),
       NSR = nsr, adjusted_SR = sr / nsr,
       adjusted_SR_CI = c(sr_lo / nsr, sr_hi / nsr))
}

# Canonical OMOP-CDM route (preferred in production):
# res <- CohortSymmetry::generateSequenceCohortSet(cdm, indexTable = "A", markerTable = "B")
# CohortSymmetry::summariseSequenceRatios(res)   # crude + adjusted SR with CIs and NSR
PSSA in SAS. Required input dataset (post data-management): work.first_fill : person_id, drug ('A'/'B'), first_date -- first incident fill per drug per person, after a continuous-enrollment washout.
%let symm = 365;   /* symmetry window in days */
%let nsr  = 1.12;  /* null-effect sequence ratio from a separate trend model */

/* One row per person with first_A and first_B; keep only those incident in BOTH drugs. */
proc sql;
  create table pairs as
  select a.person_id,
         a.first_date as first_A format=date9.,
         b.first_date as first_B format=date9.,
         (a.first_date - b.first_date) as gap
  from (select person_id, first_date from work.first_fill where drug='A') a
  inner join
       (select person_id, first_date from work.first_fill where drug='B') b
    on a.person_id = b.person_id;
quit;

/* Classify discordant orderings inside the symmetry window; drop same-day starts. */
data discordant;
  set pairs;
  where abs(gap) <= &symm and gap ne 0;
  if gap < 0 then order = 'AtoB';   /* first_A < first_B */
  else            order = 'BtoA';
run;

/* Exact-binomial CI on the A->B proportion among discordant pairs. */
proc freq data=discordant order=data;
  tables order / binomial(level='AtoB') alpha=0.05;
  exact binomial;
  output out=ssa_ci n=n_discordant binomial=p_ab;
run;

/* Map the discordant proportion to crude SR = p/(1-p), then adjust by the NSR. */
data ssa_results;
  set ssa_ci;
  crude_SR    = p_ab / (1 - p_ab);
  adjusted_SR = crude_SR / &nsr;
  /* XL_BIN / XU_BIN are the exact CI bounds emitted on the proportion scale; rescale to SR. */
  crude_SR_lo = XL_BIN / (1 - XL_BIN);  crude_SR_hi = XU_BIN / (1 - XU_BIN);
  adj_SR_lo   = crude_SR_lo / &nsr;     adj_SR_hi   = crude_SR_hi / &nsr;
run;
Citations
- [1]Hallas J. Evidence of depression provoked by cardiovascular medication: a prescription sequence symmetry analysis. Epidemiology. 1996;7(5):478-484.
- [2]Lai EC, Pratt N, Hsieh CY, et al. Sequence symmetry analysis in pharmacovigilance and pharmacoepidemiologic studies. European Journal of Epidemiology. 2017;32(7):567-582.
- [3]Wahab IA, Pratt NL, Wiese MD, Kalisch LM, Roughead EE. The validity of sequence symmetry analysis (SSA) for adverse drug reaction signal detection. Pharmacoepidemiology and Drug Safety. 2013;22(5):496-502.