Effect estimation · Analysis and reporting
Standardized Risk and Risk-Difference Curves
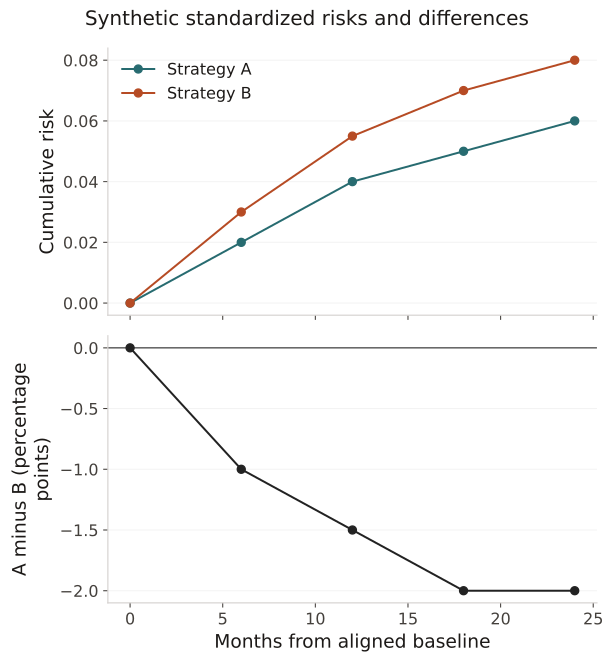
Synthetic standardized risk inputs distinguish absolute outcome probability from a treatment risk difference.
When to use it
Use after a justified standardization or other risk-estimation analysis at aligned horizons.
How to read it
At month 24 A is 6%, B is 8%, and A minus B is -2 percentage points. Adjustment and confidence intervals are not fitted here.
Worked example
Synthetic standardized risk inputs distinguish absolute outcome probability from a treatment risk difference.
At month 24 A is 6%, B is 8%, and A minus B is -2 percentage points. Adjustment and confidence intervals are not fitted here.
Result: Use after a justified standardization or other risk-estimation analysis at aligned horizons.
Produced by
Reference: Primary method sources are listed in the linked producing-method entries. The displayed data are original synthetic teaching examples, not published patient results.