Forest Plot
Compact display of an effect estimate and its confidence interval across subgroups, studies, or models, anchored on a vertical line of no effect.
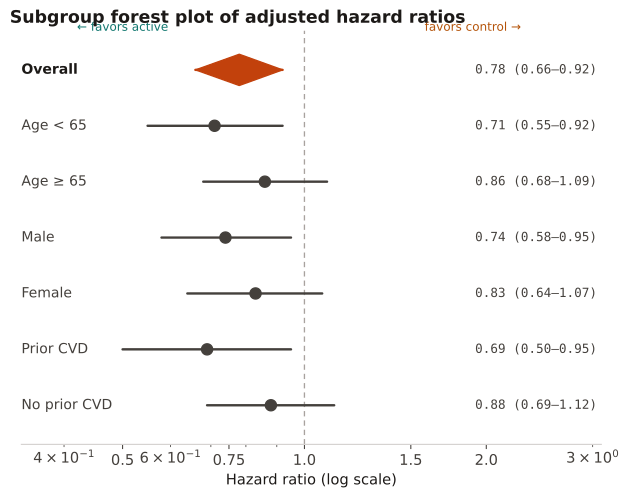
To compare a ratio measure (HR/OR/RR) across pre-specified subgroups or pooled studies. The overall estimate is shown as a diamond; subgroup heterogeneity is read from non-overlapping intervals, not from whether each crosses 1.
Marker = point estimate (area ∝ weight/precision); whiskers = 95% CI; vertical line = no effect (1.0 on a ratio scale). Use a log axis so ratios are symmetric. Avoid reading subgroup 'significance' as effect modification — test the interaction.
An adjusted Cox model gives an overall HR for the active comparator and HRs within seven pre-specified subgroups. Estimates are plotted on a log scale against the HR=1 line; the overall estimate is rendered as a diamond.
Result: All subgroup intervals overlap the overall diamond, so the data are consistent with a single ~22% hazard reduction; the Age≥65 interval crossing 1.0 reflects lower precision, not evidence of a null effect in that subgroup.
Reference: Gatto NM, Wang SV, Murk W, et al. Visualizations throughout pharmacoepidemiology study planning, implementation, and reporting. Pharmacoepidemiol Drug Saf. 2022;31(11):1140-1152.