RMST Difference by Restriction Horizon
Exactly integrated synthetic survival curves show how restricted mean survival differences depend on the horizon.
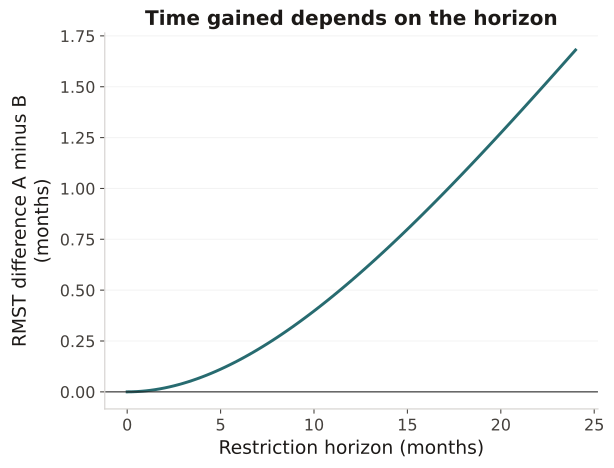
Use for a prespecified time-scale contrast; use appropriate estimators and uncertainty for actual censored data.
The two exponential rates are 0.03 and 0.04 per month. Curves are assumptions, not observed patient survival or fitted treatment effects.
Exactly integrated synthetic survival curves show how restricted mean survival differences depend on the horizon.
Result: Use for a prespecified time-scale contrast; use appropriate estimators and uncertainty for actual censored data.
Reference: Primary method sources are listed in the linked producing-method entries. The displayed data are original synthetic teaching examples, not published patient results.