Drug Utilization Study
A descriptive pharmacoepidemiologic study that quantifies the marketing, prescribing, dispensing, and use of medicines in a defined population using standardized measures (utilization volume, prevalence/incidence of use, treatment duration, adherence, and prescribing quality) rather than estimating a comparative treatment effect.
On this page
A drug utilization study describes how a medicine is actually used by a group of patients in the real world: who takes it, how much they take, how long they stay on it, and how appropriately it is prescribed. It answers "what is happening with this drug?" by counting things like the number of prescription fills, the total supply dispensed, and whether patients switch to something else. It deliberately stops there: it never claims the drug caused a good or bad outcome, because that would need a comparison group it does not have. It also can't see medicine that never goes through a pharmacy, like free samples or doses given in the hospital.
A drug utilization study (DUS) describes who uses which drugs, how much, for how long, and how appropriately in a real-world population — it is the descriptive-epidemiology workhorse of pharmacoepidemiology, not a causal design. The WHO defines drug utilization research as "the marketing, distribution, prescription, and use of drugs in a society, with special emphasis on the resulting medical, social, and economic consequences."
Outputs are population- or patient-level quantities (defined daily doses dispensed per 1,000 inhabitants per day, prevalence/incidence of treated patients, mean treatment duration, proportion of days covered, polypharmacy counts, off-label or guideline-discordant use), not adjusted hazard ratios. A DUS answers what is happening with a medicine in practice; it deliberately stops short of attributing outcomes to exposure.
Core conceptual distinction
. A DUS is descriptive; an active-comparator new-user cohort, a self-controlled case series, or a target-trial emulation is analytic/causal. The distinction is the estimand. A DUS targets a frequency, rate, or distribution (e.g., the DDD/1000/day of high-potency opioids in 2023, the 1-year persistence of GLP-1 initiators, the share of NSAID users with a concurrent gastroprotective agent). A causal study targets a contrast between counterfactual outcomes under two interventions and therefore must control confounding, align time zero, and handle informative censoring.
The two also differ in the unit of measurement: aggregate DUS works in person-time and standardized dose units (ATC/DDD) and tolerates open cohorts; individual-level DUS works in dispensing episodes per person and demands the same enrollment/washout hygiene a cohort study does, because a "new user" or "persistence" measure is only valid if prior dispensing is observable. A further subdivision (WHO/Wettermark) is drug statistics (volume/cost, often aggregate sales or claims tallies) vs quality-of-use indicators (DU90%, the proportion of prescribing within the 90% most-used drugs; potentially inappropriate medication rates by Beers/STOPP; adherence). Confusing a DUS frequency for a causal effect — "patients on drug A had more events, so drug A is harmful" — is the single most common misreading and is exactly what the descriptive framing forbids.
Pros, cons, and trade-offs
- vs an analytic cohort (e.g., active-comparator new-user): A DUS is cheaper, faster, needs no comparator, and directly answers surveillance, market-access, formulary, and stewardship questions ("is uptake growing? is prescribing concentrated? are we hitting the guideline target?"). Cost: it makes no causal claim and is uninterpretable as effectiveness/safety evidence. Prefer a DUS when the question is genuinely descriptive (volume, patterns, quality, equity of access); escalate to a cohort the moment the question becomes "does the drug change the outcome?"
- Aggregate (ATC/DDD) vs individual-level dispensing measures: Aggregate DDD/1000/day is internationally comparable, robust to enrollment gaps, and ideal for cross-country or trend monitoring; it cannot describe duration, adherence, switching, or per-patient burden. Individual-level measures (prevalence of treated persons, persistence, PDC, polypharmacy) are far richer but require longitudinal, person-linked data with observable enrollment, and the DDD may misrepresent the dose actually prescribed (pediatrics, renal dosing, titrated drugs). Prefer DDD for system-level trends and benchmarking; prefer individual-level for adherence, duration, and patient-burden questions.
- Prevalence vs incidence (new-user) of use: Prevalence (any use in a period) is simple and captures total burden but mixes long-term and starting users and is dominated by chronic prevalent users. Incidence of use (first dispensing after a drug-free washout) isolates initiation, supports uptake/diffusion analysis, and is the prerequisite for any persistence or new-user analytic follow-on. Prefer incidence whenever initiation, diffusion, or downstream causal work is the goal — and accept that it requires a washout and continuous look-back.
When NOT to use — and when it is actively misleading or dangerous
- As effectiveness or safety evidence. Comparing crude event rates between users of two drugs in a DUS is confounded by indication and channeling; presenting such a comparison as a treatment effect is the dangerous failure mode. If the question is comparative, use an active-comparator new-user cohort or a self-controlled design — not a DUS.
- Trend interpretation across a coding or formulary break. A "drop" in utilization that coincides with an ICD-10 transition, a new ATC/DDD assignment, a formulary tier change, or a database vendor switch is a measurement artifact, not a behavior change. Never narrate a trend without auditing denominator and coding stability over the window.
- DDD-based dosing inferences in populations where DDD is wrong. In pediatrics, renal/hepatic impairment, oncology, and titrated drugs, DDD/1000/day does not reflect treated patients or true exposure; reporting "X% of the population on a therapeutic dose" from DDDs there is misleading.
- Prevalence/persistence on data with unobservable enrollment. Computing "new use" or "1-year persistence" without a continuous-enrollment requirement counts gaps in observation as drug-free time or as discontinuation — fabricating both incident users and non-persistence.
- Unstable small-area or subgroup rates. Stratified DDD/1000/day or PIM rates in small denominators are noisy; presenting ranked league tables of providers/regions without stability checks invites spurious "outliers."
Data-source operational depth
- Administrative claims (FFS): The default substrate. Exposure = the pharmacy claim (`fill_date` + `days_supply` + NDC mapped to ATC; quantity for DDD conversion). Numerator = treated persons or dispensings; denominator = continuously enrolled person-time. Failure modes: Medicare Advantage (MA-only) person-time lacks fee-for-service claims, so MA enrollees appear as non-users and as artificially "new" users when they switch to FFS — restrict to enrollees with Part A/B/D (or commercial medical+pharmacy) and exclude MA-only spans, or you will undercount use and inflate incidence. 90-day mail-order and stockpiling distort `days_supply`-based duration/PDC; free samples and inpatient-administered drugs are invisible in pharmacy claims, undercounting initiation. Cash/discount-card fills (insulin, generics) bypass adjudication entirely.
- EHR: Captures prescribing/ordering (the clinical decision) but not whether the patient filled or took the drug — primary non-adherence (an order never dispensed) is only visible with linked pharmacy data. Strong for indication, dose, labs, and the numerator's clinical context; weak for the denominator because care delivered outside the system is missing and patients who leave are differentially lost. Medication-reconciliation and home-med lists are inconsistently structured. Use EHR for prescribing-quality indicators, claims for filled-utilization volume, and linked data for the full prescribe→fill→persist cascade.
- Registry: Strong for a well-defined disease denominator, severity, and indication, but typically incomplete for full pharmacy exposure; link to claims for dispensing and to a death/disenrollment index so that person-time and discontinuation are not confounded with loss to follow-up.
- Linked claims–EHR–vital records: The richest substrate (orders + fills + clinical context + reliable censoring), but linkage selects the linkable subset and introduces order/fill/service-date discrepancies that must be reconciled before defining incident use or duration. Differential competing risks by exposure matter even descriptively: in elderly claims, persistence/PDC denominators must treat death and disenrollment as competing events, or a drug used in sicker patients will look falsely "non-persistent" simply because those patients die during the supply.
Worked claims example
Question: among commercially insured + Medicare-FFS adults, what is the 2023 incidence of metformin initiation and the 1-year persistence of initiators?
- Denominator hygiene: keep only persons with ≥365 days of continuous medical + pharmacy enrollment ending in 2023 and exclude any MA-only person-time (FFS claims unobservable there).
- Identify dispensings: pharmacy claims with an NDC mapping to ATC A10BA02 (metformin), each with `fill_date` and `days_supply`.
- Incident use: a person's first 2023 metformin `fill_date` with no metformin fill in the prior 365-day washout (continuous enrollment makes this absence real, not missing). Incidence = incident users ÷ at-risk person-years (persons enrolled and metformin-free at the start of their at-risk window).
- Persistence/PDC: for each initiator, build an exposure timeline by stitching consecutive fills (`fill_date` → `fill_date + days_supply`), allowing a pre-specified grace period (e.g., 30 days) to bridge stockpiling/refill timing; discontinuation = first gap exceeding the grace period; persistence = still covered at 365 days. PDC = covered days ÷ 365 (cap stockpiled overlap at 1 day of coverage per calendar day).
- Competing risks: censor at disenrollment, death, and end of data; report persistence with death/disenrollment as competing events so that mortality in a sicker subgroup is not miscounted as non-persistence.
- Report incidence per 1,000 person-years and persistence as a Kaplan–Meier (or cumulative-incidence) curve with CIs, plus sensitivity analyses on washout length (180 vs 365 d) and grace period (15/30/60 d). Note this is purely descriptive — it characterizes use, and any comparison of metformin vs an alternative on a clinical outcome would require a separate analytic (active-comparator new-user) design.
Interpreting the output
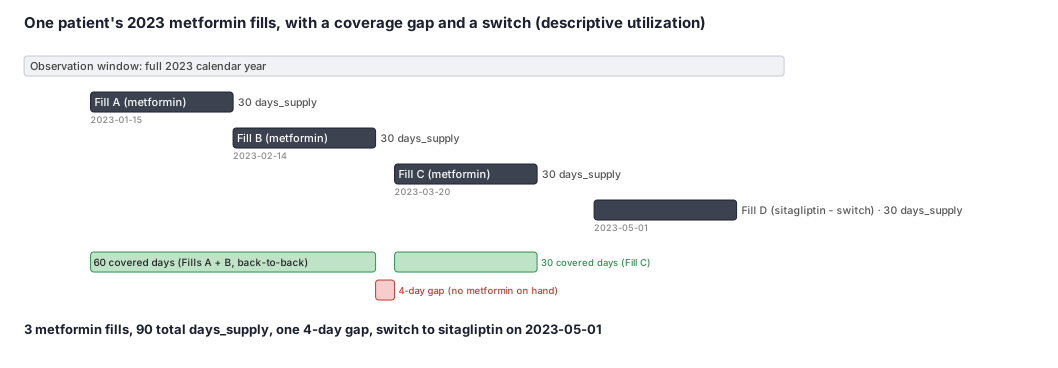
An individual-level DUS for patient Maria shows 3 metformin fills with 90 total days_supply, a 4-day gap between the second and third fill (March 16–19), and a switch to sitagliptin beginning May 1. At the system level, the 2023 incidence of metformin initiation is reported per 1,000 person-years, and 1-year persistence is presented as a Kaplan–Meier curve with competing-risk censoring.
(1) Formal interpretation. Maria's 3-fill, 90-day record is an individual exposure trajectory, not an effectiveness or safety observation. The 4-day gap falls within a pre-specified 30-day grace period and does not count as discontinuation; her PDC over the 90-day observation window is 1.00 (no uncovered days within the stitched dispensing timeline). The May 1 switch to sitagliptin is a class switch observable in pharmacy claims; the clinical reason — tolerability, glycemic inadequacy — is not captured.
Population incidence is the rate per at-risk person-years in an FFS-enrolled, washout- confirmed cohort; MA-only members are excluded because absent FFS claims cannot confirm drug-free washout. No causal inference is made: the DUS reports patterns of use, not what the drug does.
(2) Practical interpretation. The 4-day gap and subsequent class switch flag a potential adherence or tolerability signal that a stewardship team could investigate further. The system-level persistence curve is the input a payer needs to project the proportion of initiators still on therapy at 6 and 12 months — a key parameter for budget-impact models. If the question becomes whether the switch improved outcomes, an active-comparator new-user cohort study is required, not the DUS.
Decision diagram
flowchart TD
  Q[Question type?] -->|How much / by whom / how long / how appropriately| DUS[Drug utilization study DESCRIPTIVE]
  Q -->|Does the drug change the outcome?| CAUS[Analytic / causal design - NOT a DUS]
  DUS --> AGG{Aggregate or per-patient?}
  AGG -->|System volume, cross-country trend| DDD[ATC/DDD per 1000 per day]
  AGG -->|Duration, adherence, polypharmacy| IND[Individual-level dispensing measures]
  IND --> PI{Prevalent or incident?}
  PI -->|Total treated burden| PREV[Period prevalence of use]
  PI -->|Initiation / diffusion / persistence| INC[Incidence of use: washout + continuous enrollment]
INC --> EPI[Build exposure episodes -> persistence / PDC with grace period + competing risks]flowchart LR RX[Pharmacy dispensings<br/>NDC to ATC, fill_date, days_supply, ddd_dispensed] --> DM[Data management:<br/>map NDC to ATC, exclude MA-only person-time] ENR[Continuous enrollment spans] --> DM DM --> NUM[Numerator: treated persons / dispensings / DDDs] DM --> DEN[Denominator: FFS-observable enrolled person-time] NUM --> M1[Prevalence of use] NUM --> M2[Incidence of new use<br/>365d washout] NUM --> M3[DDD/1000 enrollees/day] M2 --> M4[Episodes -> persistence / PDC<br/>grace period, death/disenroll as competing risks] DEN --> M1 DEN --> M2 DEN --> M3
Worked example
Scenario
Maria is one commercially insured adult who started metformin (a common diabetes pill) in early 2023. We have her pharmacy fill records for the whole year. We are not comparing her to anyone or testing whether metformin worked. We just want to describe her use of the drug: how many times she filled it, how many days of supply she received, whether she ever ran short, and whether she eventually moved to a different medicine.
Dataset
The raw rows an analyst would actually see in a claims pharmacy table for this one patient.
| person_id | fill_date | drug | days_supply |
|---|---|---|---|
| 2001 | 2023-01-15 | metformin | 30 |
| 2001 | 2023-02-14 | metformin | 30 |
| 2001 | 2023-03-20 | metformin | 30 |
| 2001 | 2023-05-01 | sitagliptin | 30 |
Steps
Result
Utilization summary for person 2001: 3 metformin fills, 90 total days_supply, one 4-day coverage gap (Mar 16-19), and a switch to sitagliptin on 2023-05-01.
Trade-offs
Runnable example
Core drug-utilization measures from claims-style dispensing data. Required inputs (cleaned, de-duplicated): rx : pharmacy dispensings -> person_id, fill_date (datetime), atc (str), ndc, days_supply (int), ddd_dispensed (float) # ddd_dispensed = quantity * strength / WHO_DDD for that ATC, precomputed during data...
import pandas as pd
import numpy as np

WASHOUT_DAYS = 365
GRACE_DAYS = 30
TARGET_ATC = "A10BA02"  # metformin

def _enrolled_days(enroll: pd.DataFrame, start, end) -> pd.Series:
    # Continuous, FFS-observable enrolled days per person within [start, end] (exclude MA-only spans).
    e = enroll[~enroll["ma_only"]].copy()
    lo = e["enroll_start"].clip(lower=start)
    hi = e["enroll_end"].clip(upper=end)
    e["days"] = (hi - lo).dt.days.clip(lower=0)
    return e.groupby("person_id")["days"].sum()

def period_prevalence(rx, enroll, atc, start, end):
    # Prevalence of use = persons with >=1 qualifying fill in [start, end] / persons with any enrolled time in window.
    used = rx[(rx["atc"] == atc) & rx["fill_date"].between(start, end)]["person_id"].nunique()
    denom = (_enrolled_days(enroll, start, end) > 0).sum()
    return used / denom

def incidence_of_use(rx, enroll, atc, start, end):
    # Incident user = first qualifying fill in [start, end] with no fill of the same ATC in the prior WASHOUT_DAYS,
    # and continuous FFS-observable enrollment across that washout. Rate per 1000 person-years at risk.
    drug = rx[rx["atc"] == atc].sort_values(["person_id", "fill_date"])
    first_in = drug[drug["fill_date"].between(start, end)].groupby("person_id")["fill_date"].min()
    prior = drug.merge(first_in.rename("idx"), on="person_id")
    had_prior = prior[(prior["fill_date"] < prior["idx"]) &
                      (prior["fill_date"] >= prior["idx"] - pd.Timedelta(days=WASHOUT_DAYS))]["person_id"].unique()
    cand = first_in[~first_in.index.isin(had_prior)]
    wash_ok = _enrolled_days(enroll, start - pd.Timedelta(days=WASHOUT_DAYS), end)
    incident = cand[cand.index.isin(wash_ok[wash_ok >= WASHOUT_DAYS].index)]
    pyears = _enrolled_days(enroll, start, end).sum() / 365.25
    return 1000.0 * len(incident) / pyears, incident

def ddd_per_1000_per_day(rx, enroll, atc, start, end):
    # WHO aggregate metric: total DDDs dispensed in window / (enrolled person-days) * 1000.
    ddds = rx[(rx["atc"] == atc) & rx["fill_date"].between(start, end)]["ddd_dispensed"].sum()
    person_days = _enrolled_days(enroll, start, end).sum()
    return 1000.0 * ddds / person_days

def one_year_pdc(rx, initiators_idx, atc):
    # PDC over 365 days from each initiator's index date; coverage capped at one day per calendar day (no stockpile credit).
    drug = rx[rx["atc"] == atc]
    out = {}
    for pid, idx in initiators_idx.items():
        fills = drug[drug["person_id"] == pid].sort_values("fill_date")
        fills = fills[fills["fill_date"].between(idx, idx + pd.Timedelta(days=364))]
        covered = np.zeros(365, dtype=bool)
        for fd, ds in zip(fills["fill_date"], fills["days_supply"]):
            s = (fd - idx).days
            covered[max(s, 0):min(s + int(ds), 365)] = True  # union -> caps overlap (stockpiling)
        out[pid] = covered.mean()
    return pd.Series(out, name="pdc")
Core drug-utilization measures with data.table. Inputs mirror the Python version: rx : person_id, fill_date (Date), atc, ndc, days_supply (int), ddd_dispensed (double) enroll : person_id, enroll_start (Date), enroll_end (Date), ma_only (logical) # ma_only spans lack FFS claims Returns period prevalence, incidence of...
library(data.table)
WASHOUT_DAYS <- 365L
TARGET_ATC <- "A10BA02"

enrolled_days <- function(enroll, start, end) {
  e <- enroll[ma_only == FALSE]
  e[, days := pmax(0L, as.integer(pmin(enroll_end, end) - pmax(enroll_start, start)))]
  e[, .(days = sum(days)), by = person_id]
}

period_prevalence <- function(rx, enroll, atc, start, end) {
  used  <- uniqueN(rx[atc == ..atc & fill_date %between% c(start, end), person_id])
  denom <- nrow(enrolled_days(enroll, start, end)[days > 0])
  used / denom
}

incidence_of_use <- function(rx, enroll, atc, start, end) {
  drug <- rx[atc == ..atc][order(person_id, fill_date)]
  first_in <- drug[fill_date %between% c(start, end),
                   .(idx = min(fill_date)), by = person_id]
  prior <- merge(drug, first_in, by = "person_id")
  had_prior <- unique(prior[fill_date < idx &
                            fill_date >= idx - WASHOUT_DAYS, person_id])
  cand <- first_in[!person_id %chin% had_prior]
  wash <- enrolled_days(enroll, start - WASHOUT_DAYS, end)[days >= WASHOUT_DAYS, person_id]
  incident <- cand[person_id %chin% wash]
  pyears <- sum(enrolled_days(enroll, start, end)$days) / 365.25
  list(rate_per_1000_py = 1000 * nrow(incident) / pyears, initiators = incident)
}

ddd_per_1000_per_day <- function(rx, enroll, atc, start, end) {
  ddds <- rx[atc == ..atc & fill_date %between% c(start, end), sum(ddd_dispensed)]
  pdays <- sum(enrolled_days(enroll, start, end)$days)
  1000 * ddds / pdays
}
Core drug-utilization measures in SAS from claims-style dispensing data. Required inputs (post data-management): work.rx : person_id, fill_date, atc, ndc, days_supply, ddd_dispensed (qty*strength/WHO_DDD) work.enroll : person_id, enroll_start, enroll_end, ma_only (0/1) # ma_only spans lack FFS claims Produces period...
%let washout = 365;
%let atc = A10BA02;            /* metformin */
%let win_start = '01JAN2023'd;
%let win_end   = '31DEC2023'd;

/* FFS-observable enrolled person-days in the window (exclude MA-only spans). */
proc sql;
  create table pdays as
  select person_id,
         sum( max(0, (min(enroll_end, &win_end) - max(enroll_start, &win_start)) ) ) as days
  from work.enroll
  where ma_only = 0
  group by person_id;
quit;

/* Period prevalence of use = users in window / persons with any enrolled time. */
proc sql;
  select (select count(distinct person_id) from work.rx
            where atc = "&atc" and &win_start <= fill_date <= &win_end)
         / (select count(*) from pdays where days > 0) as period_prevalence;
quit;

/* Incident users: first 2023 fill with no same-ATC fill in the prior washout, washout fully enrolled. */
proc sql;
  create table first_in as
  select person_id, min(fill_date) as idx format=date9.
  from work.rx where atc = "&atc" and &win_start <= fill_date <= &win_end
  group by person_id;

  create table incident as
  select f.person_id, f.idx
  from first_in f
  where not exists (select 1 from work.rx p
                    where p.person_id = f.person_id and p.atc = "&atc"
                      and p.fill_date <  f.idx
                      and p.fill_date >= f.idx - &washout)
    and exists      (select 1 from work.enroll e
                    where e.person_id = f.person_id and e.ma_only = 0
                      and e.enroll_start <= f.idx - &washout
                      and e.enroll_end   >= f.idx);
quit;

/* Incidence per 1000 person-years and aggregate DDD/1000 enrollees/day. */
proc sql;
  select 1000 * (select count(*) from incident)
              / ( (select sum(days) from pdays) / 365.25 )            as incidence_per_1000_py,
         1000 * (select sum(ddd_dispensed) from work.rx
                   where atc = "&atc" and &win_start <= fill_date <= &win_end)
              / (select sum(days) from pdays)                          as ddd_per_1000_per_day;
quit;

/* Optional: age-standardize utilization rates to a reference population. */
proc stdrate data=work.rx_by_age refdata=work.std_pop
             method=direct stat=rate(mult=1000);
  population event=users pyears=person_years;
  strata age_group;
run;
Citations
- [1]Rasmussen L, Wettermark B, Steinke D, Pottegård A. Core concepts in pharmacoepidemiology: Measures of drug utilization based on individual-level drug dispensing data. Pharmacoepidemiology and Drug Safety. 2022;31(10):1015-1026.
- [2]Hallas J. Drug utilization statistics for individual-level pharmacy dispensing data. Pharmacoepidemiology and Drug Safety. 2005;14(7):455-463.