Landmark Analysis Design Diagram
The landmark method drawn in the Schneeweiss/Gatto convention — a fixed landmark time splits the timeline into a classification window (response/exposure assessed using only pre-landmark information) and outcome follow-up that restarts at the landmark among landmark survivors.
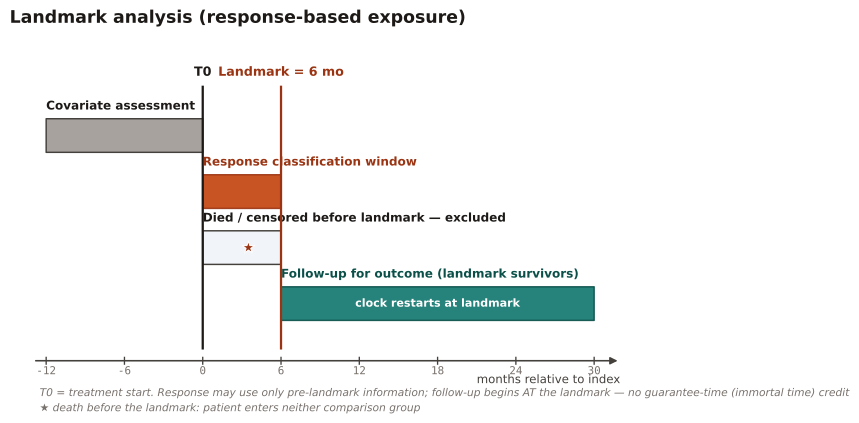
Whenever exposure or response is defined AFTER time zero (tumor response, adherence at 6 months, treatment completion). Comparing survival by a post-baseline classification from T0 gives the classified group guaranteed survival time; the landmark design removes that guarantee-time (immortal time) bias by restricting to patients event-free at a pre-specified landmark and restarting the clock there.
Read left to right. The classification window ends exactly at the landmark line — any information to its right must not influence group assignment. Follow-up bars must start at the landmark, never at T0. Patients who die or leave observation before the landmark appear in the excluded lane; they belong to neither comparison group.
1,000 patients start therapy at T0. Response is classified over the first 6 months. 120 die and 40 disenroll before the 6-month landmark, leaving 840 landmark survivors (310 responders, 530 non-responders) whose outcome follow-up runs from month 6 to month 30.
Result: Because classification uses only pre-landmark information and follow-up restarts at month 6 for both groups, responders receive no guaranteed survival credit — the naive from-T0 comparison would have required responders to survive long enough to respond, biasing them to look better even under no true effect.
Reference: Anderson JR, Cain KC, Gelber RD. Analysis of survival by tumor response. J Clin Oncol. 1983;1(11):710-719.